Automatic Check of Expiration Date of GPG keys

Automatic Check of Certification Expiration Date

After Heartbleed I wrote a small python script to have an automatic check of certification expiration date. The script is hosted on Github.

GPG Keys

Next to SSL certificates there are also GPG keys that can (but do not have to) have an expiration date. If you manage a lot of (personal or shared) keys it can become difficult to keep track of expired or soon to be expired keys.

Check Expiration Date of GPG keys

So I wrote a similar python script to alert you on expired GPG keys.
GithubLogo
The script is also hosted on Github. You can download the raw version at https://github.com/cudeso/tools/blob/master/cedg.py.

Initially I thought of writing a script that looked up the expiration date of the keys on a keyserver. This didn’t work. A helpful message on the mailing list explained why :

GPG’s keyserver code is capable of displaying expiration date, if the keyserver provides it. Not all do.

Also note that (as also stated in the mailing list reply), you should not blindly trust the information received from the keyservers.

How does it work?

The script uses python-gnupg, which is nothing more than a python wrapper around GnuPG. In fact if you add verbose=True to the init of the GPG object you get the verbose output that is passed to the GPG binary via the python package.

gpg = gnupg.GPG(gnupghome=gpg_location, verbose=True)

It also needs access to the GPG keyring (that is defined in gpg_location). In order to not overwrite any of the keys you use during your daily work I suggest that you create a separate user (for example gpgtest). Additionally you can also use that user to launch the script via cron (see below).

Inline configuration

The script has a number of inline configuration options.

  • keys_to_check = “cedg.checks” : this is the most important one, it is a text file with the keyids you’d like to check
  • alert_days = 5 : how many days to take into account before alerting
  • mail_rcpt = “<>“ : the recipient of the mail alert
  • mail_from = “<>“ : the sender of the mail alert
  • mail_server = “127.0.0.1” : the mail server to use
  • key_server = “keyserver.ubuntu.com” : the keyserver to download the GPG keys from
  • gpg_location = “/home/gpgtest/.gnupg” : the location of the keyring
  • delete_keys = True : delete keys upon startup
  • import_keys = True : import the keys from keyserver
  • simple_output = False : minimal reporting

How do I use it?

First step is to create a user gpgtest and run the script as this user.

Add the keyids you’d like to check to cedg.checks (or the file defined by keys_to_check) and set proper mail recipients, senders and mail server.

There are two ways you can use the script, manually importing the keys and then have them checked or automatically import them from a keyserver. Both have their pros and cons.

Manual checks

If you want to do checks on keys that you manually imported you have to disable deleting keys and doing the import.

delete_keys = False
import_keys = False

The disadvantage is that you have to do key management manually. The advantage is that you can verify them and make sure you are using the proper keys. More trust, less user friendly.

Automatic checks

Alternatively you can always import the key that is available on the keyserver. It is advisable to delete all keys before starting so you always have a fresh set of keys.

delete_keys = True
import_keys = True

The disadvantage is that with this method you trust that the keyserver provided information is correct. The advantage is that you do not have to be concerned about manually importing keys.

Cron

Ideally you run this script from cron. For the example below, make sure that the user gpgtest is allowed to run cron jobs (cron.allow)

30 12   * * *   gpgtest    /home/gpgtest/tools/cedg.py  > /dev/null 2>&1

Example report

This is how an (extended) report looks like

Start with deleting keys
 Delete key ( 4A201BD879E4184E ) [u'US-CERT Security Operations Center <soc@us-cert.gov>'] 
 Delete key ( 06AD6EABE96C965B ) [u'US-CERT Information <info@us-cert.gov>'] 
 Delete key ( 7767844F108B7661 ) [u'US-CERT Publications Key <us-cert@us-cert.gov>'] 
 Delete key ( 623F0B8353977C01 ) [u'CERT.be <cert@cert.be>'] 
Key deletion finished

Importing keys
Process key 0x79E4184E :  Imported
Process key 0xE96C965B :  Imported
Process key 0x108B7661 :  Imported
Process key 0x53977C01 :  Imported

Parsing keys
 Key ( 4A201BD879E4184E ) [u'US-CERT Security Operations Center <soc@us-cert.gov>'] expires in 147 days (2014-09-30 19:19:34) 
 ** Key ( 06AD6EABE96C965B ) [u'US-CERT Information <info@us-cert.gov>'] has EXPIRED (2013-09-30 21:55:24) **
 ** Key ( 7767844F108B7661 ) [u'US-CERT Publications Key <us-cert@us-cert.gov>'] has EXPIRED (2013-09-30 20:16:51) **
 No expiration date ( 623F0B8353977C01 ) [u'CERT.be <cert@cert.be>'] 

Automatic Check of Expiration Date of Certificates

Certificate expiration

After Heartbleed and generating lots of different new certificates I searched for a tool that sends me an alert when a certificate is about to expire. Basically I need an automatic check of expiration date of certificates. My requirements were

  • daily checks;
  • notification by email;
  • check for certificates on internal and external network;
  • check for certificates on non-web service (imap, pop, …).

There are a couple of tools that cover part of my requirements but not one tool that did everything that I needed. So I made it myself.

Check Expiration Date of SSL certificates

ceds.py is a python script that reads a file as input (ceds.checks) and does a SSL check on every host listed in the file. The script has a couple of inline configuration parameters.

servers_to_check = "ceds.checks"
alert_days = 5
mail_rcpt = "<>"
mail_from = "<>"
mail_server = "localhost"
  • servers_to_check : the file with the hosts to check;
  • alert_days : how days before expiration to send an alert;
  • mail_rcpt : sender of the alert;
  • mail_from : receiver of the alert;
  • mail_server server to use to send the alert.

GithubLogo
The script is available on Github, download the raw version at https://raw.githubusercontent.com/cudeso/tools/master/ceds.py.

Cron

Ideally you run this script from cron.

30 12   * * *   user	/home/user/tools/ceds.py  > /dev/null 2>&1

Graphing Terena CRL stats

Heartbleed

heartbleed

The OpenSSL heartbleed vulnerability CVE-2014-0160 has been all over the news this month. I posted an overview on what to do and how to detect exploit attempts.

Certificate revocations

Generating new certificates is one of the advices to cope with this vulnerability. A new certificate means that you have to revoke the old one. Revoked certificates are ‘announced’ in a CRL, or a certificate revocation list.

Graphing CRL content

SANS ISC has a graph on certificates revoked per day. This graph is based on different sources. I am only interested in the CRL revocation data of Terena. Below are the graphs for the Terena CRL list. It is generated with a Python script (see below).

You can see a spike shortly after the announcement of the Heartbleed bug but I would have expected to see a higher number of requested revoked certificates.

Script to generate stats

The Python script generates a JSON file that is used to feed a Google Chart. It uses a file TERENASSLCA.crl.parsed that is the output of parsing the CRL file through OpenSSL.

wget --output-document TERENASSLCA.crl http://crl.tcs.terena.org/TERENASSLCA.crl
openssl crl -in TERENASSLCA.crl -inform DER -text > TERENASSLCA.crl.parsed
#!/usr/bin/python
# 
# Koen Van Impe - Google Chart graphs based on Terena CRL
#
# In cron:
#    wget http://crl.tcs.terena.org/TERENASSLCA.crl
#    openssl crl -in TERENASSLCA.crl -inform DER -text > TERENASSLCA.crl.parsed
#

crl = open('TERENASSLCA.crl.parsed', 'r')
crl_json = open('terena-crl.json', 'w')
revoc_match = 'Revocation Date:'
revoc_date = 'Last Update:'
crl_data = {}
update_date = 'Unknown'

# Init dictionary
for x in range(1, 31):
    crl_data[ x ] = 0

# Walk through CRL file
for line in crl:
    pos = line.find( revoc_match )
    pos_update = line.find( revoc_date )
    if pos > 0 :        # A line indicating a revoked certificate?       
        date = line[(pos + len( revoc_match )):].strip().split(' ')
        # Only grab the Apr2014 (could also add an extra 'match' above)
        if date[0] == 'Apr' and date[3] == '2014':
            day = int(date[1])
            crl_data[ day ] = crl_data[ day ] + 1
    elif pos_update > 0:
        update_date = line[(pos_update + len( revoc_date )):].strip()

# Build JSON        
crl_json.write( '{"update_date": "' + update_date + '", \n "googlechart": ')
crl_json.write( '{"cols":[{"type":"string"},{"type":"number","label":"hits"}] \n')
crl_json.write( ', "rows":[ \n')

row = 1
for item in crl_data:
    json_line = '{"c":[{"v":"' + str(item) + '/Apr"},{"v":"' + str(crl_data[ item ]) + '"}]} '
    if row != len(crl_data):
        json_line = json_line + " , "
    crl_json.write ( json_line + "\n")
    row = row + 1
    
crl_json.write( ']} }\n')

# Cleanup
crl.close()
crl_json.close()

Ulogd-viz, visualize iptables / netfilter / ufw logs

Graphing iptables stats

I have iptables on a couple of different Linux hosts. There are a number of tools that allow you to centralize the logs of different hosts (and services) but they often focus on some form of alert management. I need something that allows me to gather the logs from different hosts, put them all in one central database and then generate some statistics on this data.

Iptables logs to the local syslogger but ulogd allows for extra logging features.

Showcase

A couple of screenshots to show what ulogd-viz is all about.


Ulogd, map iptables log

ulogd is a userspace logging daemon for netfilter/iptables related logging. I use it to log firewalled packets to a mysql database.

Ulogd is available as a package on most popular Linux flavors but it is possible that you get an older version. If you need version 2 you’ll probably will have to compile everything from source.

Visualizing

Having the packets in a database does not mean you can easily make sense out of it. I needed a tool to visualize the number of events. I would also like to have them outlined on a map to get some idea on the origin of events. A posting on the blog of Xavier Mertens, “” has a Perl script that maps everything on a Google Maps. This covers part of my question. I preferred one tool that could do both so I write my own tool, in PHP.

Ulogd-viz

ulogd-viz is available on Github.

It is written in PHP and requires

Install ulogd

I will not cover how to get ulogd running. Basically you need to make sure it logs to a mysql database. The configuration is done in /etc/ulogd.conf. To activate mysql enable the correct plugin.

plugin="/usr/lib/ulogd/ulogd_MYSQL.so"

Defining what packets it needs to log exactly is a matter of inserting the log rule in the right place in the iptables log rule set.

If you are using UFW and want to filter everything (careful because this can easily fill the available drive space) that comes in then use this rule

iptables -I ufw-before-input  -j ULOG --ulog-nlgroup 1 --ulog-prefix ULOG

Install ulogd-viz

GithubLogo

The easiest way to get ulogd-viz is by cloning it. Go to the directory where you’d like to install it and start

git clone https://github.com/cudeso/ulogd-viz.git

Remember that ulogd-viz does not have any authentication or ACL features. If you want to limit access (strongly recommended) you will have to set this in the server configuration. It would also be a very bad idea to install this on a public available web server without proper authentication and access control.

All the configuration is done in two files, config/ulogd.php and config/ulogd.ini. The cloned git directory contains a default config file, you just have to copy it to a working config file.

cp config/ulogd.ini.default config/ulogd.ini

Database

ulogd-viz needs to be able to read the content of the database. Enter the correct credentials in the database section.

[database]
username = 
password = 
database = 
host = localhost
ulogtable = ulog

It is not entirely necessary but in order to use the ‘shortcut’ feature of ulogd-viz you will need to add an additional table. You can find the create script at db/create.sql. Ulogd-viz will run just fine but the ajax request for get.php?shortcut=get will return errors. Notice that this request has a rand value added to prevent caching (&rand=3376).

Geoip and Google API

The next thing that you need is a copy of the Maxmind GeoIP database. Download the GeoLite City database, extract it and move it to the library location.

Now get a Google API key and look up your ‘home’ coordinates on Google Map. Packets that match with RFC1918 will be geo-mapped to this location.

Now add all this information to the configuration file

[geoip]
database = "/var/www/htdocs/ulogd-viz/library/geoipdb.dat"
googlemaps = "enterkey"
home_latitude = "50.8387"
home_longitude = "4.363405"

Web server

Make sure you configure your web server to have its default documentroot set to the www directory. Test if you can access the site by browsing to it and consult the web server logs if something does not work as expected.

Dashboard screen

The first screen that you get is the dashboard. The upper part of the dashboard allows you to select a 1 : timeframe (last hour, last day, last week, …), filter on 2 : ports and protocols and filter on 3 : source or destination IP.

From the dashboard you can select three different 4 : output types

  • Charts and tables will give you a Google Chart and a Google Table, exportable to a CSV;
  • Maps renders a Google Map with the source of the IPs mapped out geographically;
  • Table lists the recorded entries, but capped with a maximum that is set in the configuration file (this maximum is set to prevent database connection timeouts).

You can add multiple ports and multiple ips. Once you are done you can generate the result by clicking on 5 : Generate.

The lower part of the dashboard provides some shortcuts to useful graphs and statistics. These are for example the list of detected hits for a blacklist, the top 5 ports, etc. You can click on the info blocks to get the full query.

Dashboard filters

The dashboard allows you to filter the results and restrict the results to a selected timeframe.

The 1 : timeframe allows you to select the results for the last hour, last day, last week , etc.

You can then filter on 2 : protocol and 3 : port. If you do not set a port then it will just filter out the protocol. If you select ICMP as a protocol then the port field will act as a filter for the ICMP code.

Additionally you can 4 : include or exclude a 5 : single IP, either 6 : source, destination or both.

Charts and Tables

The first output type is the Google Chart and Tables screen. It prints out the firewall entries in a graph and a table.

If you have not selected to filter on a port / protocol you’ll get a single line graph and single column table. If you have selected a filter port / protocol filter in the dashboard screen you’ll get a multi-line graph with the 1 : Graph legend printed on the right. For every line in the graph you get a 2 : Table column. Remember that the filter on port / protocol is limited to five entries. Filters for IPs are not displayed on the graph. These entries are depending on your choice in the dashboard, omitted from the results or only the results from the selected IPs are displayed.

You can 3 : Export to CSV or 4 : Save the query as a shortcut.

You can go back to the dashboard with 5 : Run another query.

Maps

The output to a map returns a Google Map with the geo location of the IPs mapped out on the map.

The entries are filtered depending on the filters that you had previously set in the dashboard (similar as for Charts and Tables).

Tables

The last output that is available is the raw table output.

This outputs a table with the maximum records capped to (default) 10000 records to prevent (javascript) timeouts when generating the table. You can use the table 1 : sorting or 2 : filtering options to search for the entries you’re interested in.

Tools

The tools menu has a tool that allows you to convert timestamps (timestamp <-> user readable format) and IPs (ip notation <-> long notation).

Statistics

The statistics page provides some of the statistics that can already be found on the dashboard page, extended with other useful information.

Blacklist

You can set up a blacklist against which the logged entries are checked. This will not block any packets! It will only reveal if your firewall detected access to certain IPs (for example known C2-servers).

The blacklist itself is a text file with an IP per line. The location is set in the configuration file.

Cron to clean-up

There is a cron script that can automatically clean up the older entries. In the configuration file you can define how long files have to be kept. You should add the execution of this cron script somewhere in your cron tab.

10 5	* * *	root	php <enter_path_to_ulogd-viz>/config/cron.php

You can execute the cron script manually with

php config/cron.php

If you do not run the clean up script then the number of logged entries will only grow. Depending on how much drive space you have reserved for the database this could fill your entire drive.

Centralize the logs

The setup described above has the web server (and database server) on the host on which the firewall is running. This is not always desirable. Ideally you run a database server locally on each host to collect the events and then export these events to a central database.

ulogd-viz does not have a “host” identifier by which you can select from the centralized database only the events for a specific firewall. In order to do this, you’ll have to filter by destination address.

Setup

You can achieve this result in a number of ways.

  1. Open mysql via a management interface, allow incoming mysql traffic (use the encryption and authentication features of mysql);
  2. Have mysql run in an SSL tunnel;
  3. Dump the data locally and transfer it via SSH (see example below);
#!/bin/bash
# Dump data locally; then copy to central server
mysqldump -u root -p'ulogd-pw' ulogd > ulogd-dump.sql 
cat ulogd-dump.sql | ssh -i privatekey -l myuser 10.0.0.1 mysql -u ulogd-import -p'ulogd-import'  ulogd-central

Roadmap

  • Select on MAC ID;
  • Generate report from the cron-job (PDF);

Heartbleed, the OpenSSL vulnerability. What Should I Do?

Update 10-Apr-2014

    Jump to Update 10-Apr-2014

Update 11-Apr-2014

    Jump to Update 11-Apr-2014

Update 12-Apr-2014

    Jump to Update 12-Apr-2014

Update 24-Apr-2014

    Jump to Update 24-Apr-2014


CVE-2014-0160

heartbleed

Unless you’ve been hiding under a rock you must have heard about the OpenSSL heartbleed vulnerability CVE-2014-0160.

Software using or linked against OpenSSL 1.0.1 through 1.0.1f (inclusive) is vulnerable. This post focuses on what you have to do and how you can detect it. This post is not on what the vulnerability is about.

No logging

It is important to realize that exploitation of this vulnerability leaves no traces. Exploitation happens in the SSL handshake negotiation, that is BEFORE the service gets the request. Your web server will not log a faulty entry.

Am I affected?

Yes!

Everyone using a computer is affected.

I run a service with SSL, what should I do?

  • Patch
  • Generate new certificate
  • Inform users

  • Patch your system!
  • If patching is not possible, you can try to recompile your software with the handshake removed from the code by using -DOPENSSL_NO_HEARTBEATS;
  • Restart the affected service (reboot?);
  • Do you store user data (accounts, chats, emails, banking information, …)?
    • No : then you are done
    • Yes :
      • Request or create a new service (server) certificate and install it;
      • Revoke the old certificate;
      • Investigate what data might have been breached. Chat? Email?;
      • Inform your users and ask them to be vigilant;
      • Inform your users that their data might have been leaked;
      • Reset the password of all of your users;

If you run a company you should ask (require) your users to avoid the use of public wifi networks. This makes sure that they become not the victim of a MiTM attack (the man-in-the-middle attack were someone impersonates a web site).

Also be aware of the fact that if an attacker was able to record (f.e. through malware on your host, …) your up-until-now encrypted data, that attacker can now decrypt that data / traffic (going back for about two years).

I am a user, what should I do?

  • Ask your service provider if they have updated?
  • Change your password
  • Use a browser that checks for revoked certificates

  • Check that your service provider has patched its systems;
  • Check that your service provider is using a new certificate;
  • How can I verify if my service provider patched and renewed the certificate? See the references in How do I know if my provider has updated it systems;
  • Verify that your browser checks if a certificate is revoked;
  • See how to verify this under How to verify if my browser checks for revoked certificates?
  • Change your password;
  • Be aware that data (chats, emails, banking information) that you considered as ‘safe’ before could have been leaked.

Potentially you have to change your passwords with all the service providers that you use. However if they have not updated their systems, changing your password will not help you. Your data will remain at risk until your provider has fixed their systems.

How do I know if my provider has updated it systems?

Ask them! A number of online tools provide checks but be aware that this information might not be completely accurate. Use at your own risk.

The test of SSLlabs shows the output of the certificate in use. Pay special attention to the “Valid From” (or similar date). If it is a new certificate and they passed the test then this means thay took the necessary actions.

How to verify if my browser checks for revoked certificates?

All major browser do some form of revoking checking, they just do it all differently. You can use the post from Spiderlabs to get some more insight.

(Large scale) patching

Patching a large set of servers can be a daunting task. The people at Pantheon describe how they patched 60,000+ Drupal & WordPress sites in 12 hours.

Part of the patching process can (should) also involve requesting a new certificate. If you are part of JaNET you can get free certificates.

Mitigation, block traffic via your firewall

If you are unable to upgrade your system or patch your code then you are left with a mitigation method.

You can block the exploit requests with a firewall rule. ECSC SOC published the set of rules below on Securityfocus.

# Log rules
iptables -t filter -A INPUT -p tcp --dport 443 -m u32 --u32 "52=0x18030000:0x1803FFFF" -j LOG --log-prefix "BLOCKED: HEARTBEAT"

# Block rules
iptables -t filter -A INPUT -p tcp --dport 443 -m u32 --u32 "52=0x18030000:0x1803FFFF" -j DROP

You can also disable Perfect Forward Secrecy (PFS). This can help minimize the damage in the case of a secret key leak.

Detection

Actual exploitation will not trigger a log entry. But you can detect exploitation attempts with a number of IDS rules.

For example Suricata published a set of rules that you can use to detect attempts.

Fox-IT released a number of Snort rules that detect attempts.

alert tcp any [!80,!445] -> any [!80,!445] (msg:"FOX-SRT - Suspicious - SSLv3 Large Heartbeat Response"; flow:established,to_client; content:"|18 03 00|"; depth: 3; byte_test:2, >, 200, 3, big; byte_test:2, <, 16385, 3, big; threshold:type limit, track by_src, count 1, seconds 600; reference:cve,2014-0160; classtype:bad-unknown; sid: 1000000; rev:4;)

alert tcp any [!80,!445] -> any [!80,!445] (msg:"FOX-SRT - Suspicious - TLSv1 Large Heartbeat Response"; flow:established,to_client; content:"|18 03 01|"; depth: 3; byte_test:2, >, 200, 3, big; byte_test:2, <, 16385, 3, big; threshold:type limit, track by_src, count 1, seconds 600; reference:cve,2014-0160; classtype:bad-unknown; sid: 1000001; rev:4;)

alert tcp any [!80,!445] -> any [!80,!445] (msg:"FOX-SRT - Suspicious - TLSv1.1 Large Heartbeat Response"; flow:established,to_client; content:"|18 03 02|"; depth: 3; byte_test:2, >, 200, 3, big; byte_test:2, <, 16385, 3, big; threshold:type limit, track by_src, count 1, seconds 600; reference:cve,2014-0160; classtype:bad-unknown; sid: 1000002; rev:4;)

alert tcp any [!80,!445] -> any [!80,!445] (msg:"FOX-SRT - Suspicious - TLSv1.2 Large Heartbeat Response"; flow:established,to_client; content:"|18 03 03|"; depth: 3; byte_test:2, >, 200, 3, big; byte_test:2, <, 16385, 3, big; threshold:type limit, track by_src, count 1, seconds 600; reference:cve,2014-0160; classtype:bad-unknown; sid: 1000003; rev:4;)

Trisul has a post describing how to use a LUA script in flowmonitor to monitor for attacks.

Verification

Qualys can detect the vulnerability with the QID 42430 check in QualysGuard VM.

The popular nmap tool has a NSE script that can detect vulnerable servers.

nmap -p 443 --script ssl-heartbleed <target>

You can scan for vulnerable sites with the Nessus Vulnerability Scanner

Besides these automated (or semi-automated) tools there are Python scripts that can do the job for you. The heartbleed-masstest script on Github is by far the easiest to use. You should clone it to your machine and then run it against your infrastructure.

git clone https://github.com/tdussa/heartbleed-masstest.git
./ssltest.py --ports "443, 993, 995" hostlist.txt

Next to this script there is the quick and dirty ssltest.py.

Github also contains a list of Top 10000 Alexa sites that were scanned for the OpenSSL vulnerability.

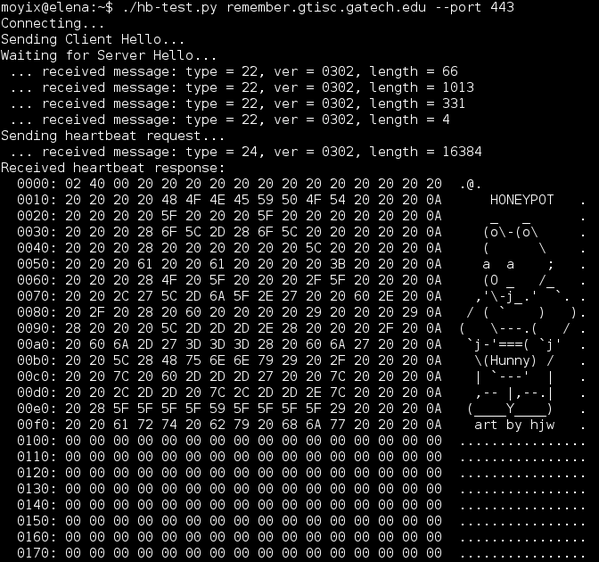
Running a heartbleed honeypot

You can set up a honeypot that mimics a vulnerable server with a Perl script published on Packetstormsecurity. You will have to run the script in a loop to track connections.

while :; do ./hb_honeypot.pl.txt ; sleep 1 ; done

Client software

So far most attention has been towards servers and services. The same vulnerability however also applies to client software. One of the attack vectors that comes immediately to mind is via a MiTM attack.

There is a script on Github, Pacemaker, that allows you to test if client software is vulnerable. After starting the Python server you can test your client software.

./pacemaker.py -t 3 -x 1

wget -O /dev/null https://google.com https://localhost:4433

Leaking private keys, or not

A posting on Errata Security claims that it is not immediately possible that your private key can leak. The user information, meaning credentials and session IDs, would still be at risk.

Other resources

The best resource with information that you can use to talk to your management is a powerpoint presentation from @malwarejake.


Update 10-Apr-2014

An update with new information on the Heartbleed problem.

Beware of ‘Password reset’ phishing scams

It’s no suprise that cybercriminals are abusing heartbleed to send out fake ‘password reset’ emails. A posting on the blog of Sophos, Nakesecurity, has good advice : do not include a login link. Including a link to your login page might sound convenient but it is not a good idea. From a behavioural point of view, it’s so much better if you don’t include a link, because you aren’t educating your users. You should educate them so that they do not click on the sort of links that these scammers love.

Should I change my passwords?

Mashable released a list of sites on which you have to change your password. Use this list with common sense! A far better approach is to check with the online tool of Lastpass if a site is vulnerable and if they have already updated. If they have update then it is time to patch. Changing your password on a site that has not yet updated its infrastructure is not going to help to deal with this issue (changing a password is never a bad thing but it will not help you in this case).

Are your private keys at risk?

A couple of posts claim that private keys were not at risk. These claims have been corrected. Although it is unlikely that your private keys get leaked it is not impossible. There is a bigger risk of leakage when you just reset your service. It still seems best to play on the safe side and have your keys reset.

Exploit attempts dating back to November 2013?

The EFF has a post that describes a case where Terrence Koeman has detected inbound packets dating back to November 2013 that are similar to the packets listed in the widely circulated proof-of-concept exploit. The packets originate from 193.104.110.12 and 193.104.110.20. If you have packet captures from these host (in fact, the entire 193.104.110.0/24 network) you might want to investigate and talk to your local security team.

Sourcefire VRT rules

Sourcefire released Snort rules update for heartBleed.

Enable certificate revocation checks in Chrome

A tweet from Tim Tomes shows how to check that certificate revocation checks are enabled in Chrome.

Thierry Zoller released a comparision of certificate handling in different TLS Stacks and Browsers.

Update 11-Apr-2014

Does it affect clients? – v2

Yes, it does. But not the most popular ones. For mobile devices however, if you are using Android then you should start to worry because it uses OpenSSL widely.

You can test your own clients with the online reverse heartbleed test or by setting up Pacemaker.

usage: pacemaker.py [-h] [-6] [-l LISTEN] [-p PORT]
                    [-c {tls,mysql,ftp,smtp,imap,pop3}] [-t TIMEOUT]
                    [--skip-server] [-x COUNT]

Test clients for Heartbleed (CVE-2014-0160)

optional arguments:
  -h, --help            show this help message and exit
  -6, --ipv6            Enable IPv6 addresses (implied by IPv6 listen addr.
                        such as ::)
  -l LISTEN, --listen LISTEN
                        Host to listen on (default "")
  -p PORT, --port PORT  TCP port to listen on (default 4433)
  -c {tls,mysql,ftp,smtp,imap,pop3}, --client {tls,mysql,ftp,smtp,imap,pop3}
                        Target client type (default tls)
  -t TIMEOUT, --timeout TIMEOUT
                        Timeout in seconds to wait for a Heartbeat (default 3)
  --skip-server         Skip ServerHello, immediately write Heartbeat request
  -x COUNT, --count COUNT
                        Number of Hearbeats requests to be sent (default 1)

I tested a couple of older wget versions (1.11, 1.12 and 1.13) on OSX and Linux and they *seemed* not to be vulnerable but additional tests are needed to be conclusive. According to the post of ISC on client vulnerabilities wget 1.15 is vulnerable.

The Juniper Network Connect 7.1.0 on OSX also seemed not vulnerable.

Should I patch my clients?

Yes, if there is a patch. But most probably no because there will be no patch. You might expect to receive phishing e-mails claiming to have a patch for software x, y, z. If you do install patches, make sure you get the correct, authenticated patch.

Change your password, beware with certificate checking

You should change your password. But ideally only when the site has patched its systems and has updated its certificate.

Changing the password on a still vulnerable site could make it worse. By changing the password on a vulnerable site you might be disclosing your -new- password to attackers. Verifying if a site has issued a new certificate should be straightforward by looking at the issue date (this is one of the checks that LastPass does). There have been stories about CAs not updating the issue date when creating a new certificate for this problem. So use caution if you only verify the issue date. And while you are changing passwords, get a password safe or a password manager (for example Keepass).

IDS rules

If you have an IDS and you have update the ruleset then you should still verify that it is tracking port tcp/443 (or any other SSL port that you use). Because basic IDS devices typically can not decrypt the SSL traffic a lot of system administrators have configured their IDS to not look at this traffic. Having rules without having your IDS look at the traffic is not going to help to detect the traffic. Make sure your rules work. Test them with the available test tools.

SSH

SSH, both client and server, is not vulnerable. It is not using TLS.

Metasploit module

Rapid 7 added a Metasploit module that provides a fake SSL service that is intended to leak memory from client systems as they connect.

Vulnerable vendors

Juniper released an out-of-cycle bulletin covering that ScreenOS firewalls can be exploited by remote unauthenticated attackers. When a malformed SSL/TLS protocol packet is sent to a vulnerable ScreenOS firewall, the firewall crashes. There is no patch yet, the workaround is to disable HTTPS administration.

Cisco released an advisory for its products.

VMware is investigating and determining the impact to VMware Customer Portals and web sites in relation to the OpenSSL 1.0.1 flaw.

Cloudflare Challenge

Do you like challenges? Obtain the keys from the Cloudflare Challenge server.

Extra coverage

The SANS Internet Storm Center has good coverage on vendor issues and solutions. Some of the tips and remarks in this post are based on information from SANS. Make sure you also read the comments pages.

The Register has a good detailed coverage on the heartbleed problem.

F-Secure also blogged about heartbleed.

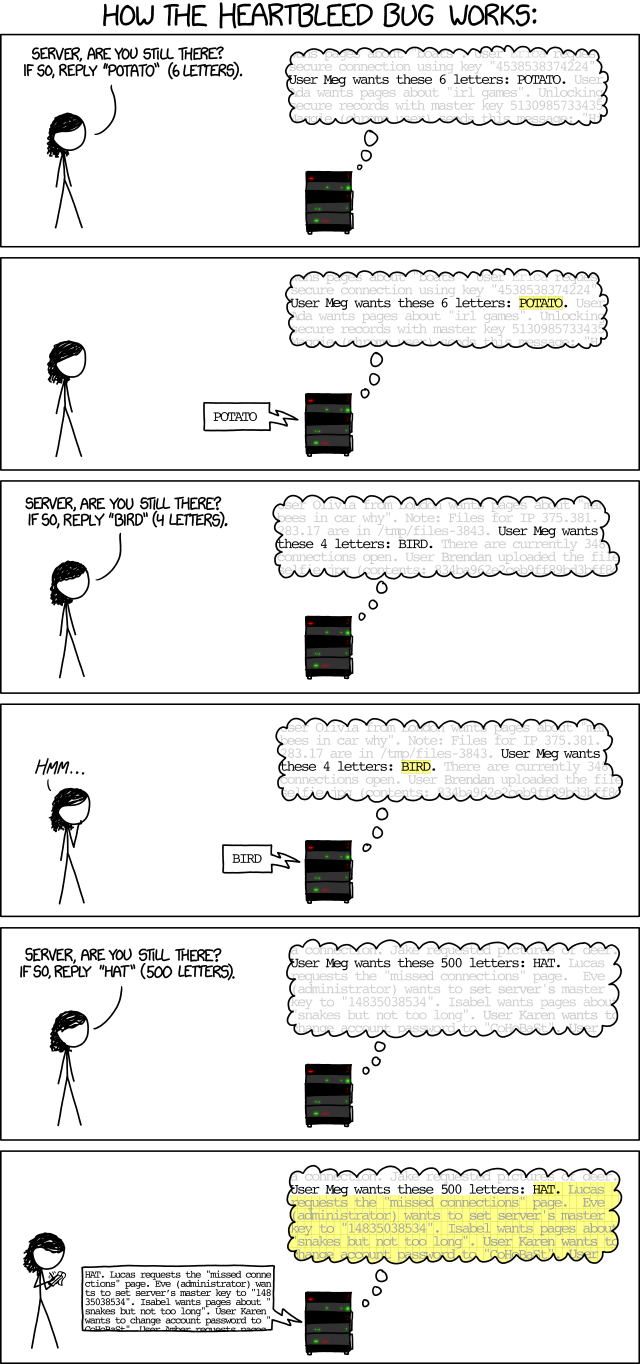
XKCD has a simple and clear explanation.

Support OpenSSL

Although so many critical infrastructure rely on OpenSSL there are little who (financially) support it. Therefore Rapid 7 published a letter from Bugcrowd for a crowdfunding initiative to raise money for a sprint bounty for OpenSSL.

NSA

According to Bloomberg the NSA knew about the heartbleed flaw. Similar reports claim that the NSA caused water to be wet.

Update 12-Apr-2014

Vulnerable Juniper VPNs

Juniper released a bulletin for the heartbleed bug in its SSL VPNs. Server side versions 7.4R1 to 7.4R9 and 8.0R1 to 8.0R3 are vulnerable. Some of the Junos Pulse and Network Connect client side applications are also vulnerable. Patch, regenerate keys, reset user and administrator credentials and delete all the active sessions!

Two factor authentication

A post on the blog of Naked Security describes how two factor authentication could have helped as a mitigation for protecting user credentials with the heartbleed bug.

Update from pfSense

pfSense released version 2.1.2 , an update with a patch for the heartbleed bug.

Detect prior heartbleed attacks

Riverbed released a python script to detect a prior OpenSSL heartbleed attack.

Update 24-Apr-2014

HP iLO devices crash

A quick check to scan your network for devices vulnerable to heartbleed would be to scan your ranges with nmap. If you have any HP iLO devices on your network this can cause problems. Older versions of iLO crash and require you to physically power reset the cards (actual removal of the power cords). This can seem a problem that you can easily deal with but if the server with the buggy iLO is an HP Bladesystem running multiple VMs then a full power reset can have a huge impact. See the HP advisory for more info.

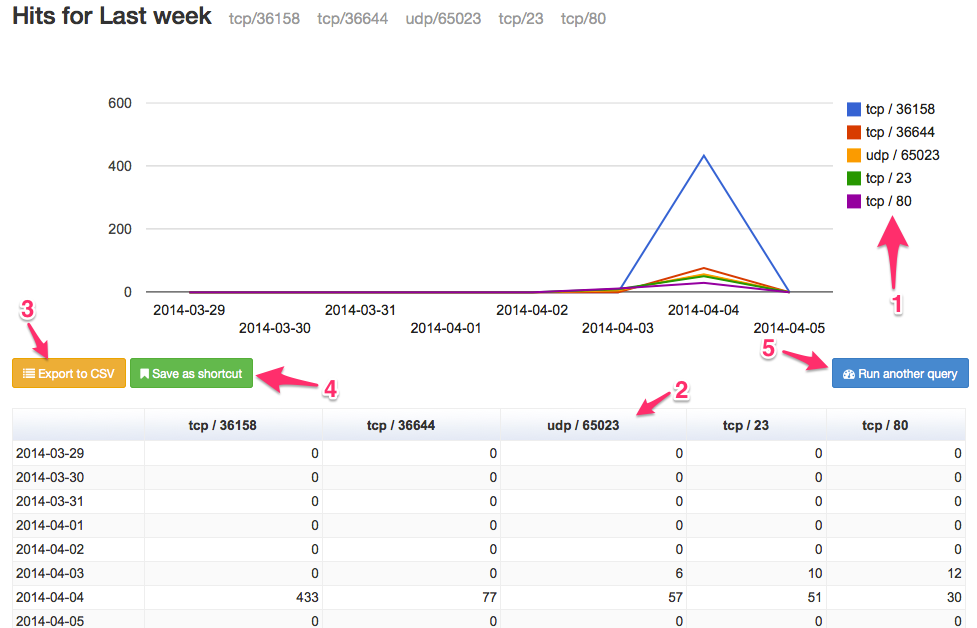
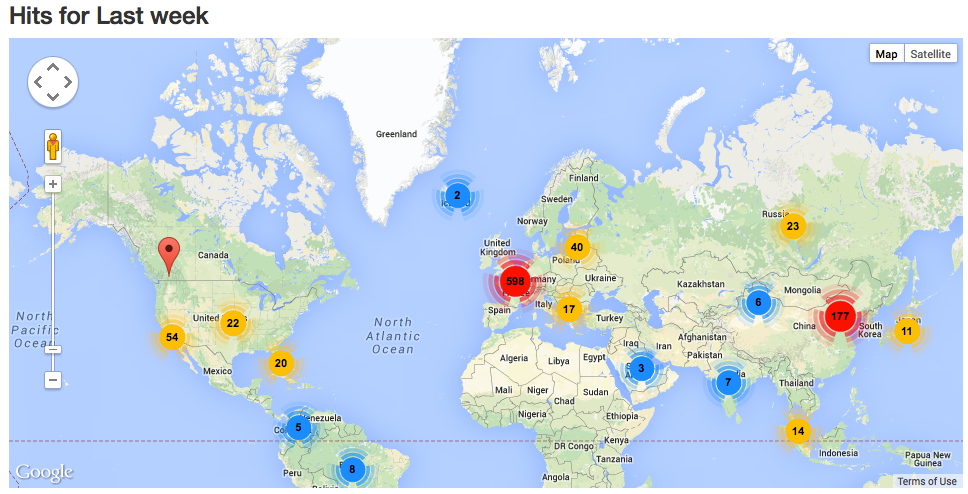
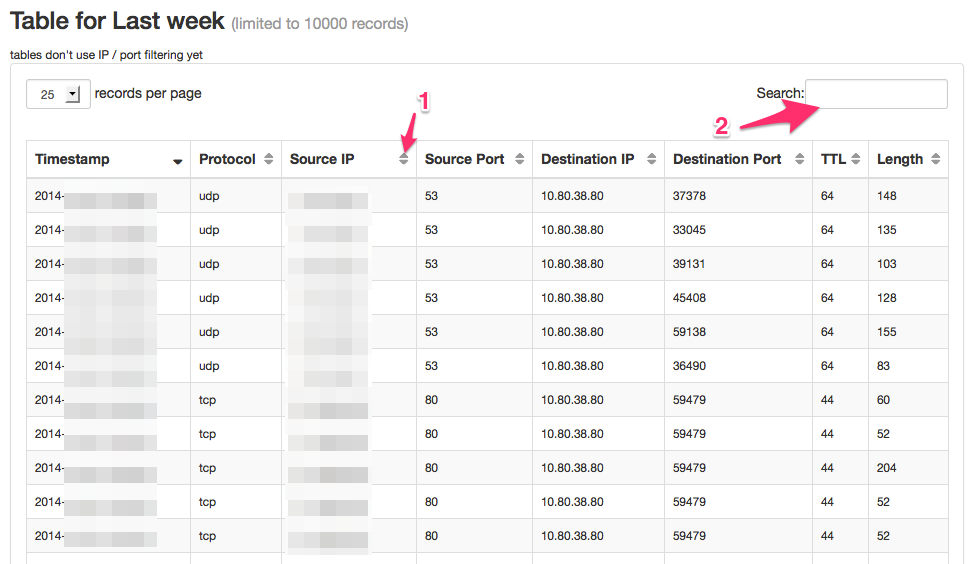
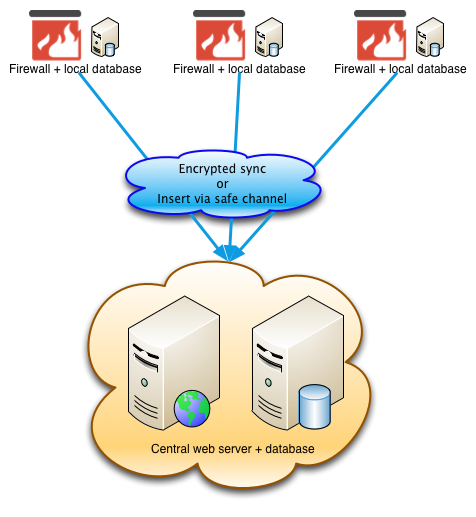
Correlate firewall logs with web server logs

A posting on ISC Sans describes a good approach to detect -abuse- of the heartbleed bug. Filter out the requests logged by your firewall to an SSL service (the post describes a web service but this applies to any service). Then match these requests by logged entries in your service log. If you then have repeated trapped firewall entries that are not in your service log it’s worth investigating further what resources (login attempts, …) these IPs tried to access.

Bugs in the heartbleed detection scripts

If you rely on one single tool to detect vulnerable heartbleed services then you are doing it wrong. The detection tools are also software. Software contains bugs. The tools seem to struggle with specific versions of TLS. So how to deal with this? Use different detection tools and use some form of IDS to detect leakage of data.

Install ModSecurity on Ubuntu (from source)

Introduction

ModSecurity is an embeddable web application firewall or WAF. It can be installed as part of your existing web server infrastructure.

ModSecurity is available as a package for different Linux distributions but these versions are often outdated. I installed ModSecurity from source on Ubuntu 12.0.4 LTS.

Download, configure, compile and install

Start by downloading the source tarball from the ModSecurity website. The full code is available via GitHub and the links to the tarballs are available from the home page.

You need a number of packages installed before the configure and compile process will complete.
If you get an error

configure: looking for Apache module support via DSO through APXS
configure: error: couldn't find APXS

then you will have to install apache2-prefork-dev.
I installed these packages :

apt-get install libxml2-dev
apt-get install libcurl4-openssl-dev
apt-get install liblua5.1-0 liblua5.1-0-dev

Additionally, if you have never compiled a package on your system then you will also have to install the compiler environment.

apt-get install build-essential

Download (version omitted from command below) and extract the package and then run the configure command.

cd /usr/local/src
wget wget https://www.modsecurity.org/tarball/modsecurity-apache.tar.gz
tar zxvf modsecurity-apache.tar.gz
cd modsecurity-apache
./configure --prefix=/usr/local

When the config command finishes without errors you can start the compile process.

make && make install

This will install the files for ModSecurity in /usr/local.

Apache configuration

The next step is to add the necessary files to load the module in apache. On Ubuntu, the module configuration files are in /etc/apache2/mods-available/. You will need to add a file /etc/apache2/mods-available/mod_security.load with this content

LoadFile /usr/lib/i386-linux-gnu/libxml2.so
LoadFile /usr/lib/i386-linux-gnu/liblua5.1.so

LoadModule security2_module /usr/local/lib/mod_security2.so
<IfModule !mod_security2.c>
error_mod_security_is_not_loaded
</IfModule>

<IfModule mod_security2.c>
Include "/etc/modsecurity/activated_rules/*.conf"
Include /etc/modsecurity/*.conf
</IfModule>

Note that the first two lines contain i386-linux-gnu. Depending on your system architecture you might have to change this. The easiest way to find out were the XML2 and Lua libraries are stored is with the find command.

find /usr/lib -iname "libxml*"

Once you have the apache module configuration file (mod_security.load) in the available module lists you can enable the module. The ModSecurity modules also needs unique_id to be enabled.

a2enmod unique_id
a2enmod mod_security

Removing Ubuntu ModSecurity files

If you had previously installed ModSecurity through a Ubuntu package than you will have to remove some files. These files contain instructions to include configuration files but similar instructions are already available in other files. Including the same files multiple times will cause an error.

rm /etc/apache2/conf.d/modsecurity2.conf
rm /etc/apache2/mods_available/mod-security.load
rm /etc/apache2/mods_available/mod-security.conf

(notice that there’s a ‘-‘ (minus) instead of an underscore.)

Module configuration

Create configuration directories

The next step is to proceed with the module configuration. Create the necessary directories and copy the basic configuration file.

mkdir /etc/modsecurity
mkdir /etc/modsecurity/activated_rules
cp /usr/local/src/modsecurity-apache/modsecurity.conf-recommended /etc/modsecurity/modsecurity.conf
cp /usr/local/src/modsecurity-apache/unicode.mapping /etc/modsecurity/

Spiderlabs rulesets

ModSecurity needs a number of rules to work properly. Download them from the GitHub account.

cd /etc/modsecurity
wget https://github.com/SpiderLabs/owasp-modsecurity-crs/tarball/master
tar zxvf master
ln -s SpiderLabs-owasp-modsecurity-crs-4ed6347 spiderlabs

Now you can make symlinks from the downloaded ruleset to the activated_rules folder. That folder will contain all the activated rules.

cd /etc/modsecurity/activated_rules
for f in /etc/modsecurity/spiderlabs/base_rules/* ; do ln -s $f . ; done

This will activate the basic rules. There are a number of other interesting rules in the folders optional_rules and slr_rules. If you run a CMS (Joomla, WordPress) you can enable the relevant rules from the slr_ruleset by using a symlink. For example to enable the WordPress rules do

cd /etc/modsecurity/activated_rules
ln -s /etc/modsecurity/spiderlabs/slr_rules/modsecurity_46_slr_et_wordpress.data .
ln -s /etc/modsecurity/spiderlabs/slr_rules/modsecurity_crs_46_slr_et_wordpress_attacks.conf .

Ruleset configuration file

Next you’ll have to download the basic ruleset configuration file to your ModSecurity directory.

cd /etc/modsecurity/
wget -O modsecurity_crs_10_setup.conf https://raw.githubusercontent.com/SpiderLabs/owasp-modsecurity-crs/master/modsecurity_crs_10_setup.conf.example 

This file sets the allowed methods, HTTP versions and provides necessary configuration settings for the ruleset.

Custom rules

Some web applications (for example the Drupal maintenance cron job) have a cron job that is run via a local web request but can trigger a ModSecurity rule. This will polute your logs. You can exclude (‘whitelist’) hosts. Create a file myruleset.conf in /etc/modsecurity

SecRule REMOTE_ADDR "@ipMatch 127.0.0.1" "phase:1,nolog,allow,id:'999001'"

Notice the ‘999001’ at the end. That must be a unique number identifying the rule (more on that later).

Disable rules

SecRuleRemoveById

You can disable rules globally or per virtual host with the SecRuleRemoveById directive. If you want to disable a rule globally then add this to the file myruleset.conf. For example to disable the rule 960015 (block requests that do not have an Accept Header) you should do

SecRuleRemoveById 960015

Disable rules per location

For some files you might want to disable ModSecurity entirely or disable a subset of rules. You can do this with the Apache directive LocationMatch. For example to prevent ModSecurity to block access to the robots.txt or favicon.ico files you could add to myruleset.conf :

<LocationMatch "/(robots.txt|favicon.ico)">
  <IfModule mod_security2.c>
    SecRuleEngine Off
  </IfModule>
</LocationMatch>

If you want to disable a list of rules for multiple web resources then you can add

<LocationMatch "/(login.asp|admin)">
  <IfModule mod_security2.c>
    SecRuleRemoveById 981172 981173
  </IfModule>
</LocationMatch>

I disabled a rule and it is not working

We mentioned the file /etc/apache2/mods-available/mod_security.load before. Look at the sequence of command. We first include all the rules and then we specify which rules to delete. If you change the order of inclusions you have the possibility that some rules get applied even though you indicated to ignore them.
So the rule of thumb is, first include all the rules and then include the file with the configuration to remove specific rules.

Logrotate the audit file

If you have enabled the logging to an audit file then you need to logrotate that file also. The audit log file setting is SecAuditLog in modsecurity.conf. Add a line to /etc/logrotate.conf

/var/log/modsec_audit.log {
    missingok
    weekly
    rotate 4
    compress
}

Found another rule with the same id

If you get a message similar to

Syntax error on line 60 of /etc/modsecurity/activated_rules/modsecurity_crs_46_slr_et_wordpress_attacks.conf:
ModSecurity: Found another rule with the same id
Action 'configtest' failed.
The Apache error log may have more information.
   ...fail!

then this means that you have multiple rules with the same id. Remember the ‘id’ field mentioned earlier if you want to whitelist hosts? It is the same id field that needs to be unique.

Change the server signature

You can change the Apache server signature with SecServerSignature.

SecServerSignature "Apache/1.2.3 (Unix)"

Test your ModSecurity rules

After all these configuration steps it is important to test if your ModSecurity setup is working as expected. Do a tail on your web server error log

tail -f /var/log/apache2/error_log

and do some of these web requests. They should all trigger an alert and you should receive a 403 or 500 HTTP error message.

/?abc=../../
/test=1+OR+1%3D1
/?<script>alert(1)</script>

Traditional vs. Anomaly Scoring Detection Modes

The newer versions of ModSecurity provide a different scoring methods. In the traditional method the rules are “self-contained.” Just like HTTP itself, the individual rules are stateless. In the Anomaly Scoring Detection, the rules will contribute to a transactional anomaly score collection. These resources provide useful reading material

Use Dropbox with encrypted volume for backups

I use Dropbox to have online backups of my files. Dropbox already provides a good set of protection mechanisms (Two-step verification, …). If you need an additional level then Boxcryptor is worth having a look.

Unfortunately Boxcryptor is not available on Linux but it is compatible with encfs. The blog of Boxcryptor has a post describing in details how you can setup encfs on Ubuntu.

The blog post lacks some useful additional details.

Have encfs available for every user

By default only root users are allowed to use encfs. You can allow non-root users to use encfs.

Modify the /etc/fuse.conf file so that the last line “user_allow_other” does NOT have a leading hash. Save and exit. You do not need to reboot.

Add the non-priv user to the group fuse

You can then use encfs:

$ encfs /home/joeuser/encrypted_data /home/joeuser/decrypted -- -o allow_other

Sync files automatically

I sync my files via rsync from crontab. Before running the rsync I verify if the encrypted volume is mounted.

#/bin/bash

if ! mount | grep encfs >/dev/null; then
 echo "ENCFS not mounted"
else
 rsync -artvuc --delete /home/joeuser/files/ /home/joeuser/decrypted/files
fi

Use ONLY_FULL_GROUP_BY with WordPress

Something I came across recently when installing WordPress gave me headaches. Everything seemed to work properly except when selecting posts by category no results were returned.

I debugged the problem by looking at the SQL-queries performed by WordPress. One query returned an error :

SELECT SQL_CALC_FOUND_ROWS  wp_posts.* FROM wp_posts  INNER JOIN wp_term_relationships ON (wp_posts.ID = wp_term_relationships.object_id) WHERE 1=1  AND ( wp_term_relationships.term_taxonomy_id IN (1) ) AND wp_posts.post_type = 'post' AND (wp_posts.post_status = 'publish') GROUP BY wp_posts.ID ORDER BY wp_posts.post_date DESC LIMIT 0, 10

Because the MySQL server was configured to honor ONLY_FULL_GROUP_BY it gave the error “‘test.wpposts.post_author’ isn’t in GROUP BY”.

I could not disable ONLY_FULL_GROUP_BY serverwide so I had to insert it in the WordPress-code.

The best place to do this was in the wp-includes/wp-db.php. Look for the function db_connect() and add the code below as the last line of the function.

mysql_query( " SET sql_mode='ANSI,TRADITIONAL' ", $this->dbh);

Note that every time you perform an upgrade of WordPress you’ll have to add this line back to the source code.

UPDATE

After implementing this change I was unable to post new posts or pages through the WordPress interface. Doing Quick Posts (through the dashboard) and update via XML-RPC works without a problem.

Lookup external IP

If you are behind a router or gateway and you need to get your public IP then you can use dyndns.org with this wget line:

wget -q -O - checkip.dyndns.org|sed -e 's/.*Current IP Address: //' -e 's/&amp;lt;.*$//'

Parse logfiles for entries from IP lists

I sometimes have to parse log files for different IP addresses and then group them by network owner. This becomes tedious If the number of IP addresses is rather long. The script below can help with automating this manual task.

It reads a log file and looks for a match based on keys in an iplist. Afterwards the result is summarized and grouped by a specified field. For example, say you have the log file

192.168.1.1 - - [1/Apr/2010:1:1:39 +0200] "GET /favicon.ico HTTP/1.1"
192.168.1.3 - - [1/Apr/2010:1:1:39 +0200] "GET /favicon.ico HTTP/1.1"
192.168.1.1 - - [1/Apr/2010:1:1:39 +0200] "GET /favicon.ico HTTP/1.1"
192.168.1.2 - - [1/Apr/2010:1:1:39 +0200] "GET /favicon.ico HTTP/1.1"
192.168.1.3 - - [1/Apr/2010:1:1:39 +0200] "GET /favicon.ico HTTP/1.1"
192.168.1.2 - - [1/Apr/2010:1:1:39 +0200] "GET /favicon.ico HTTP/1.1"
192.168.1.3 - - [1/Apr/2010:1:1:39 +0200] "GET /favicon.ico HTTP/1.1"

and you would like to have all the entries for IPs 192.168.1.2 and 192.168.1.3. Instead of grepping the content for every IP manually you can use the script below. Put all the IPs in an iplist similar to this

1234 | 192.168.1.1 | MyNet
4567 | 192.168.1.2 | MyNet
8901 | 192.168.1.3 | MyNet
2345 | 192.168.1.4 | MyNet

<?php
/**
 * 
 * Parse a log file and group by entries from another file
 *
 * This script reads a log file and then groups the entries
 * according to keys found in an iplist
 * There's no input validation so make sure neither the 
 * log file or iplist contain malicious code
 *
 * This script is useful if you want to group log file entries
 * based on AS number or network name.
 *
 * 		Koen Van Impe				cudeso.be
 *		20100525
 *
 **/

// Configuration array
$config = array(	// file containing the IPs
					"iplist" => "BE.txt",
					// logfile with the individual entries
					"logfile" => "Log_BE.txt",
					// what field to use as a separator in iplist
					"separator" => "|",
					// position of the IP (0-based)
					"ippos" => 1,
					// position of the groupby field (0-based)
					"groupby" => 0,
					// newline after a logfile
					"newline" => false
				);
				
// Array for the resultset
$result = array();
$matchcount = 0;

// walk through the IP list
if (file_exists($config["iplist"])) {
	$file_handle = fopen($config["iplist"], "r");
	while (!feof($file_handle)) {
		$fields = explode("|", fgets($file_handle));
		$key = (string) trim($fields[$config["groupby"]]);
		if (strlen($key) > 0) {
			$data = trim($fields[$config["ippos"]]);
			$result[$key][] =  $data;
		}
	}
	fclose($file_handle);
	
	// read the log file
	if ((file_exists($config["logfile"])) && count($result) > 0) {
		$logfile = file($config["logfile"]);

		echo "Parsing ".$config["logfile"]."n".
				"for matches in ".$config["iplist"]."n".
				"on field pos #".$config["ippos"]."n".
				"group by field pos #".$config["groupby"]."nnn";
		// walk through the resultset; scan the
		// log file for every entry
		// three foreachs ... optimization 
		foreach ($result as $key => $value) {
			echo "n******************n$keyn******************n";
			foreach ($logfile as $line) {
				foreach ($value as $match) {
					// is position 0 and is not BOOLEAN 
					if ((strpos($line, $match) === 0) or
					// position bigger than 0
						(strpos($line, $match) > 0)) {
							
							// we have a match
							echo "$line";
							if ($config["newline"]) echo "n";
							$matchcount++;
					}
					else $misscount++;
				}
			}
			echo "nnnn";
		}
		
		echo "nn$matchcount relevant entries found in ".$config["logfile"];
	}
}


?>