ELK setup for honeypots
The Elasticsearch ELK Stack (Elasticsearch, Logstash and Kibana) is an ideal solution for a search and analytics platform on honeypot data.
There are various howto’s describing how to get ELK running (see here, here and here) so I assume you already have a working ELK system.
This post describes how to import honeypot data into ELK. The easiest way to get all the necessary scripts and configuration files is by cloning the full repository.
git clone https://github.com/cudeso/cudeso-honeypot.git
If you know your way around with git / Github it suffices to get the raw version of the individual files (the proxy scripts and the Kibana interface).
Note that not everything is tracked in this ELK setup, I only store the information that I find useful for my proper use.
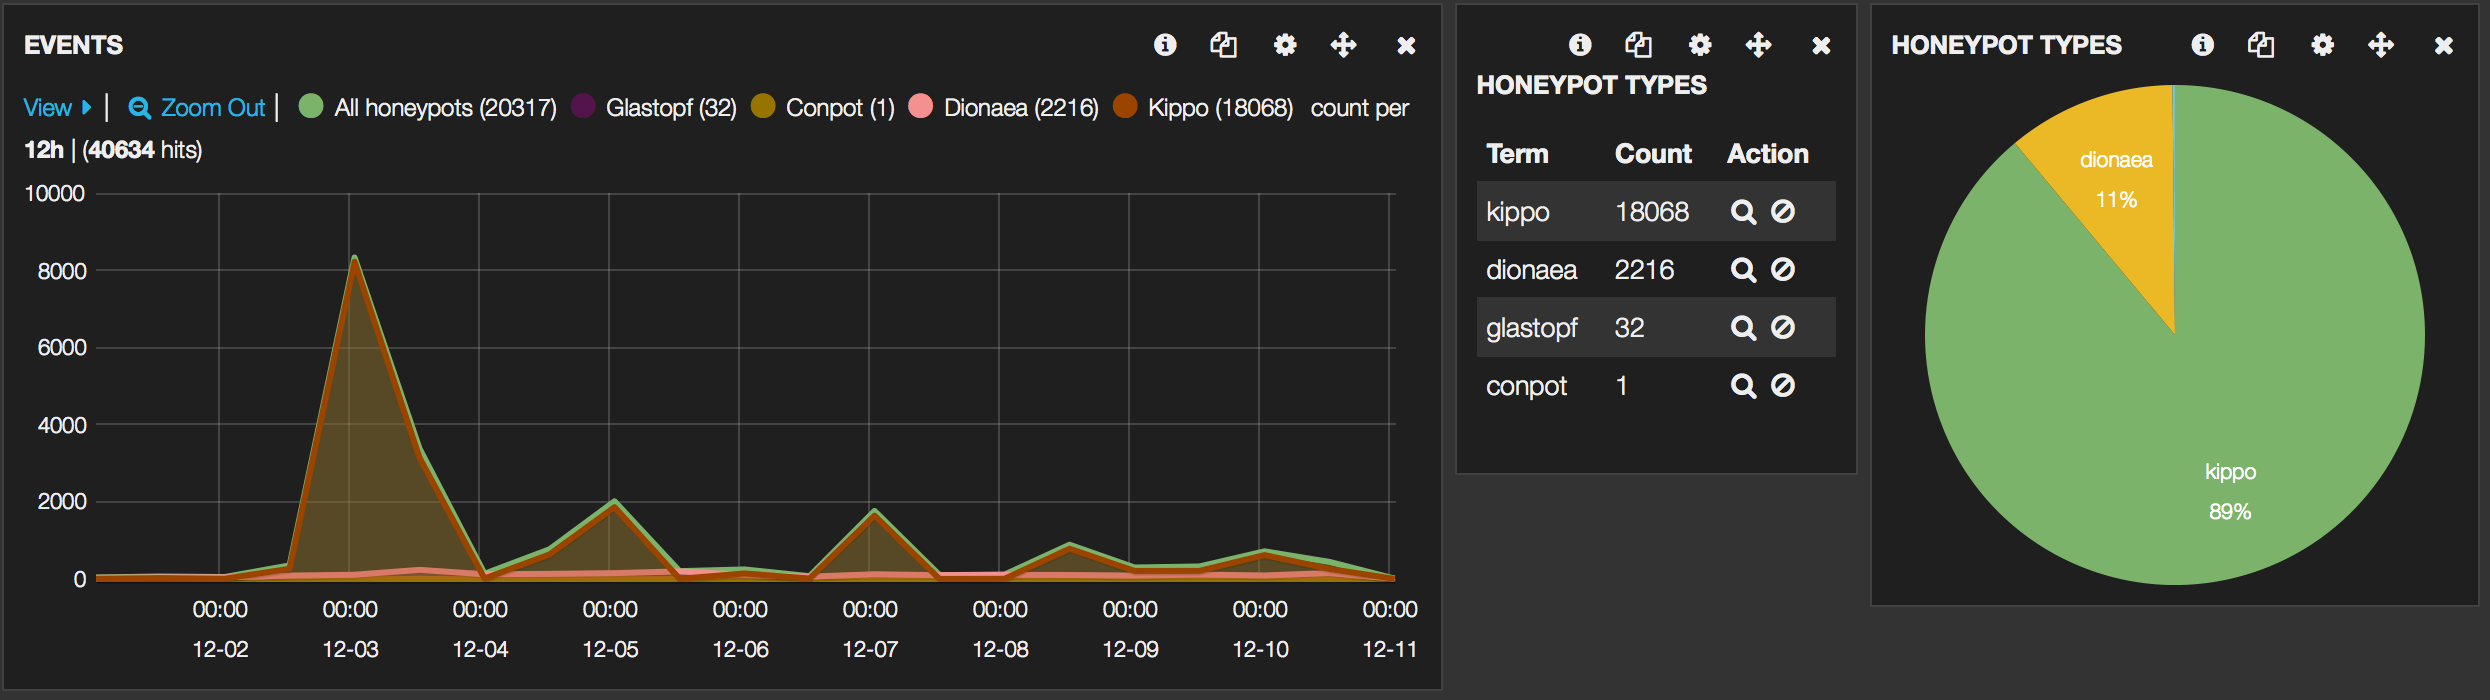
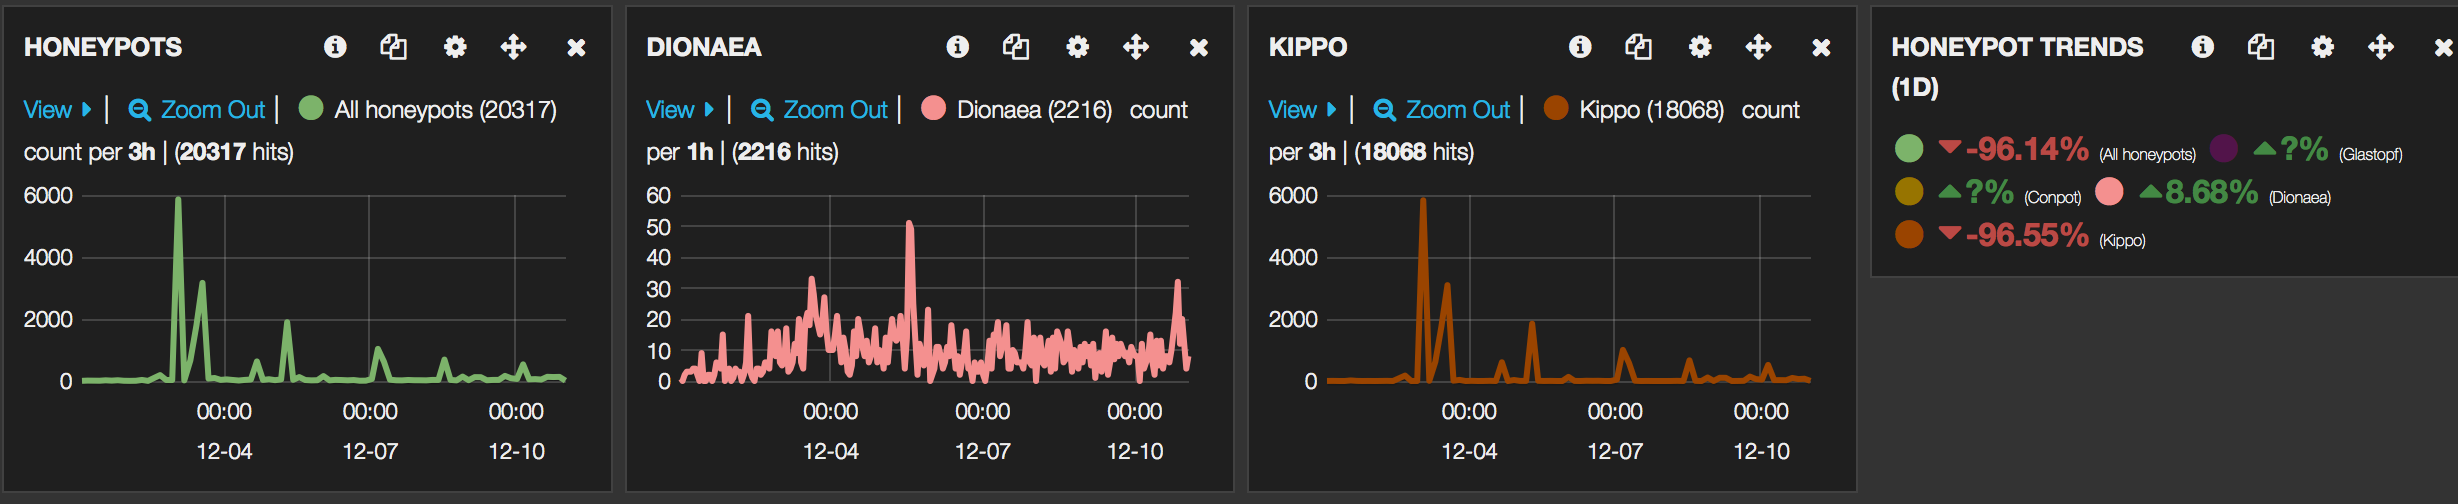
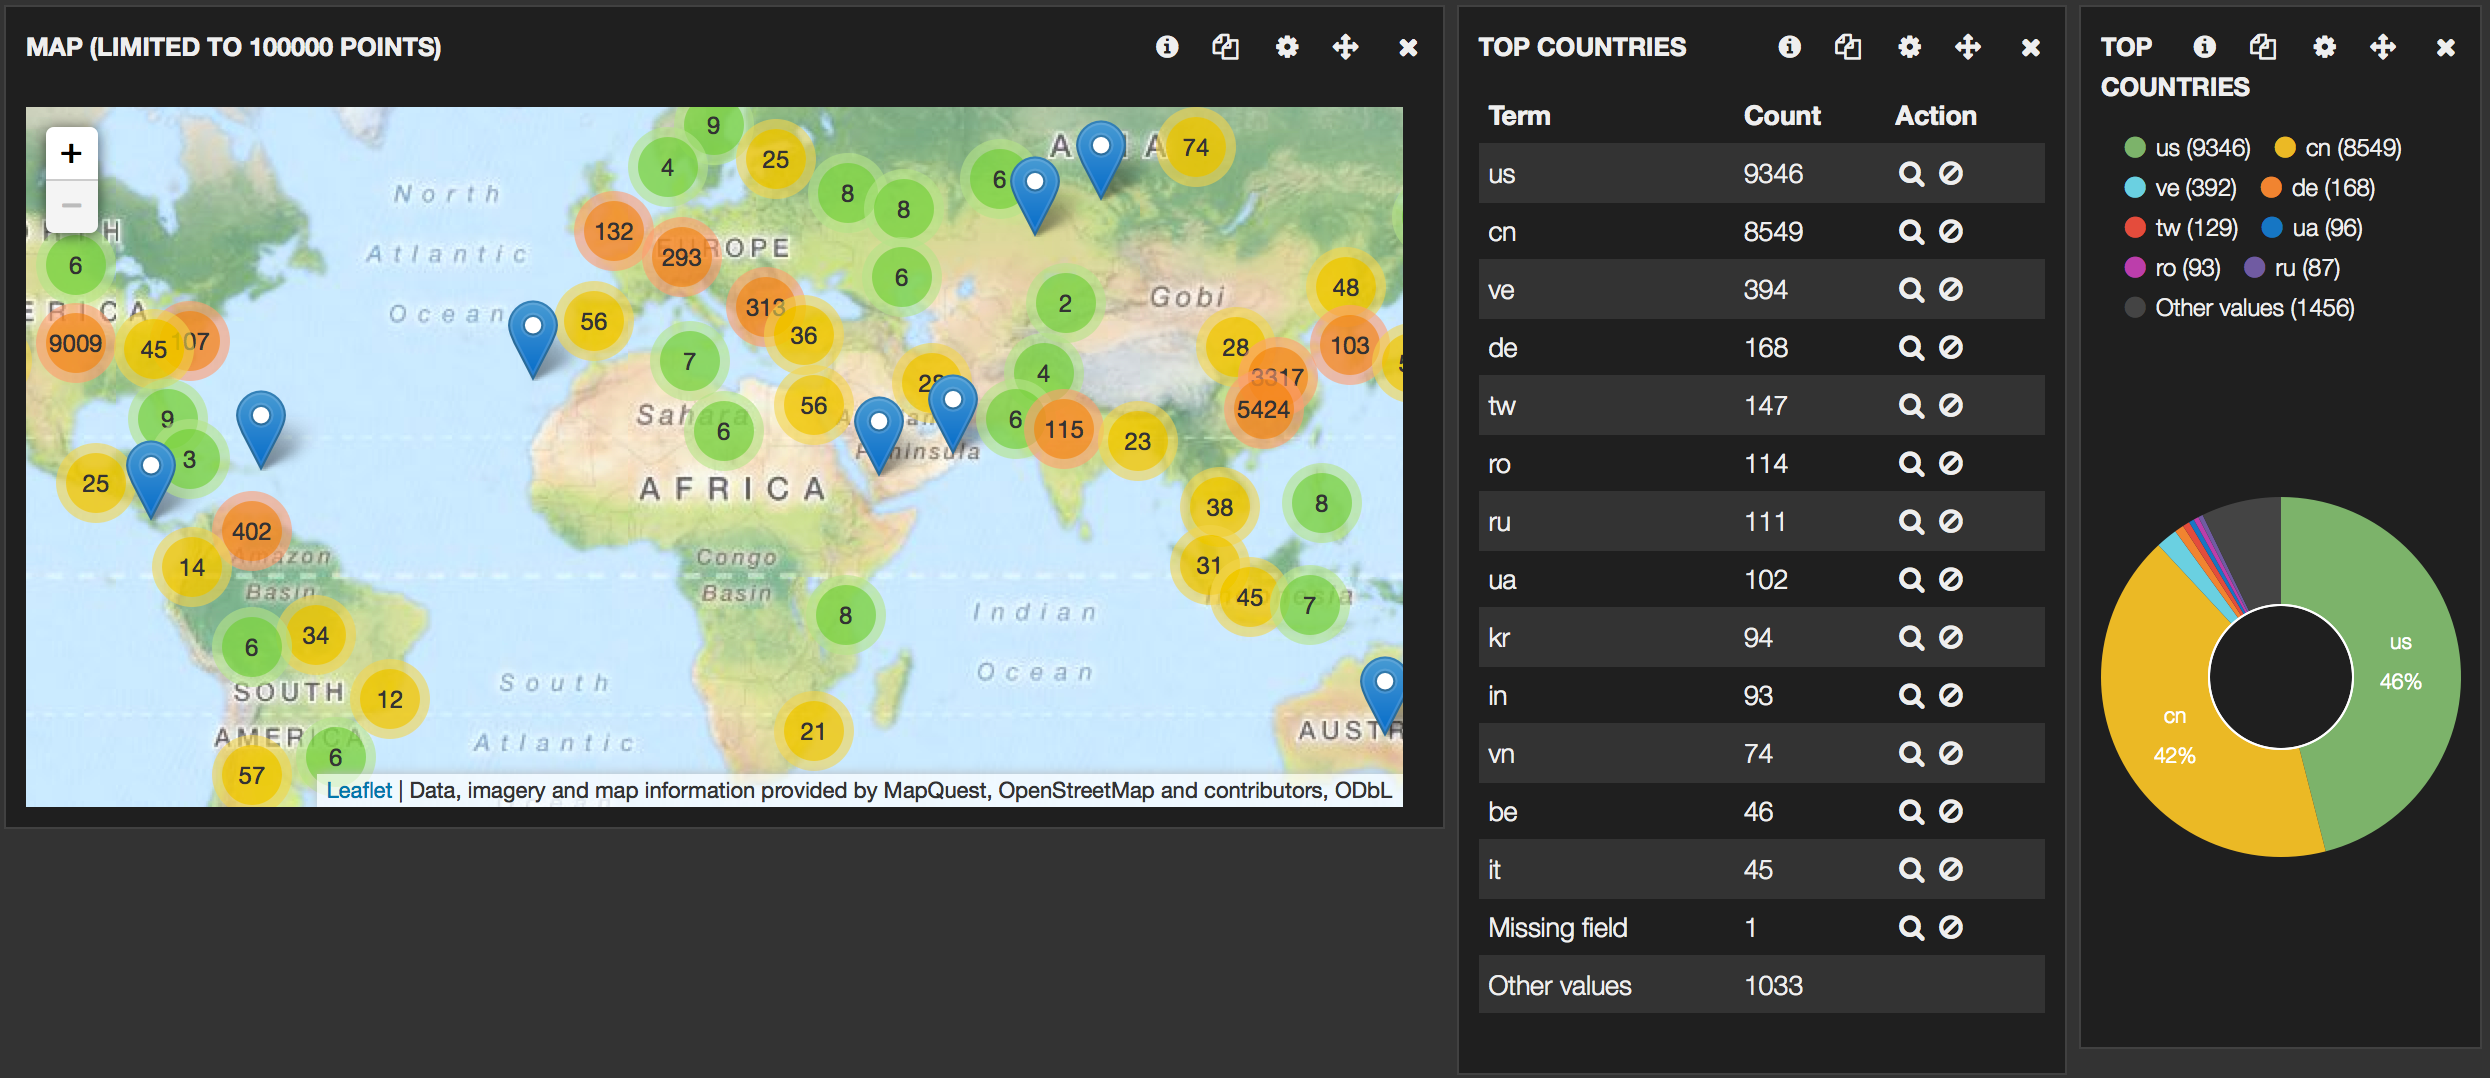
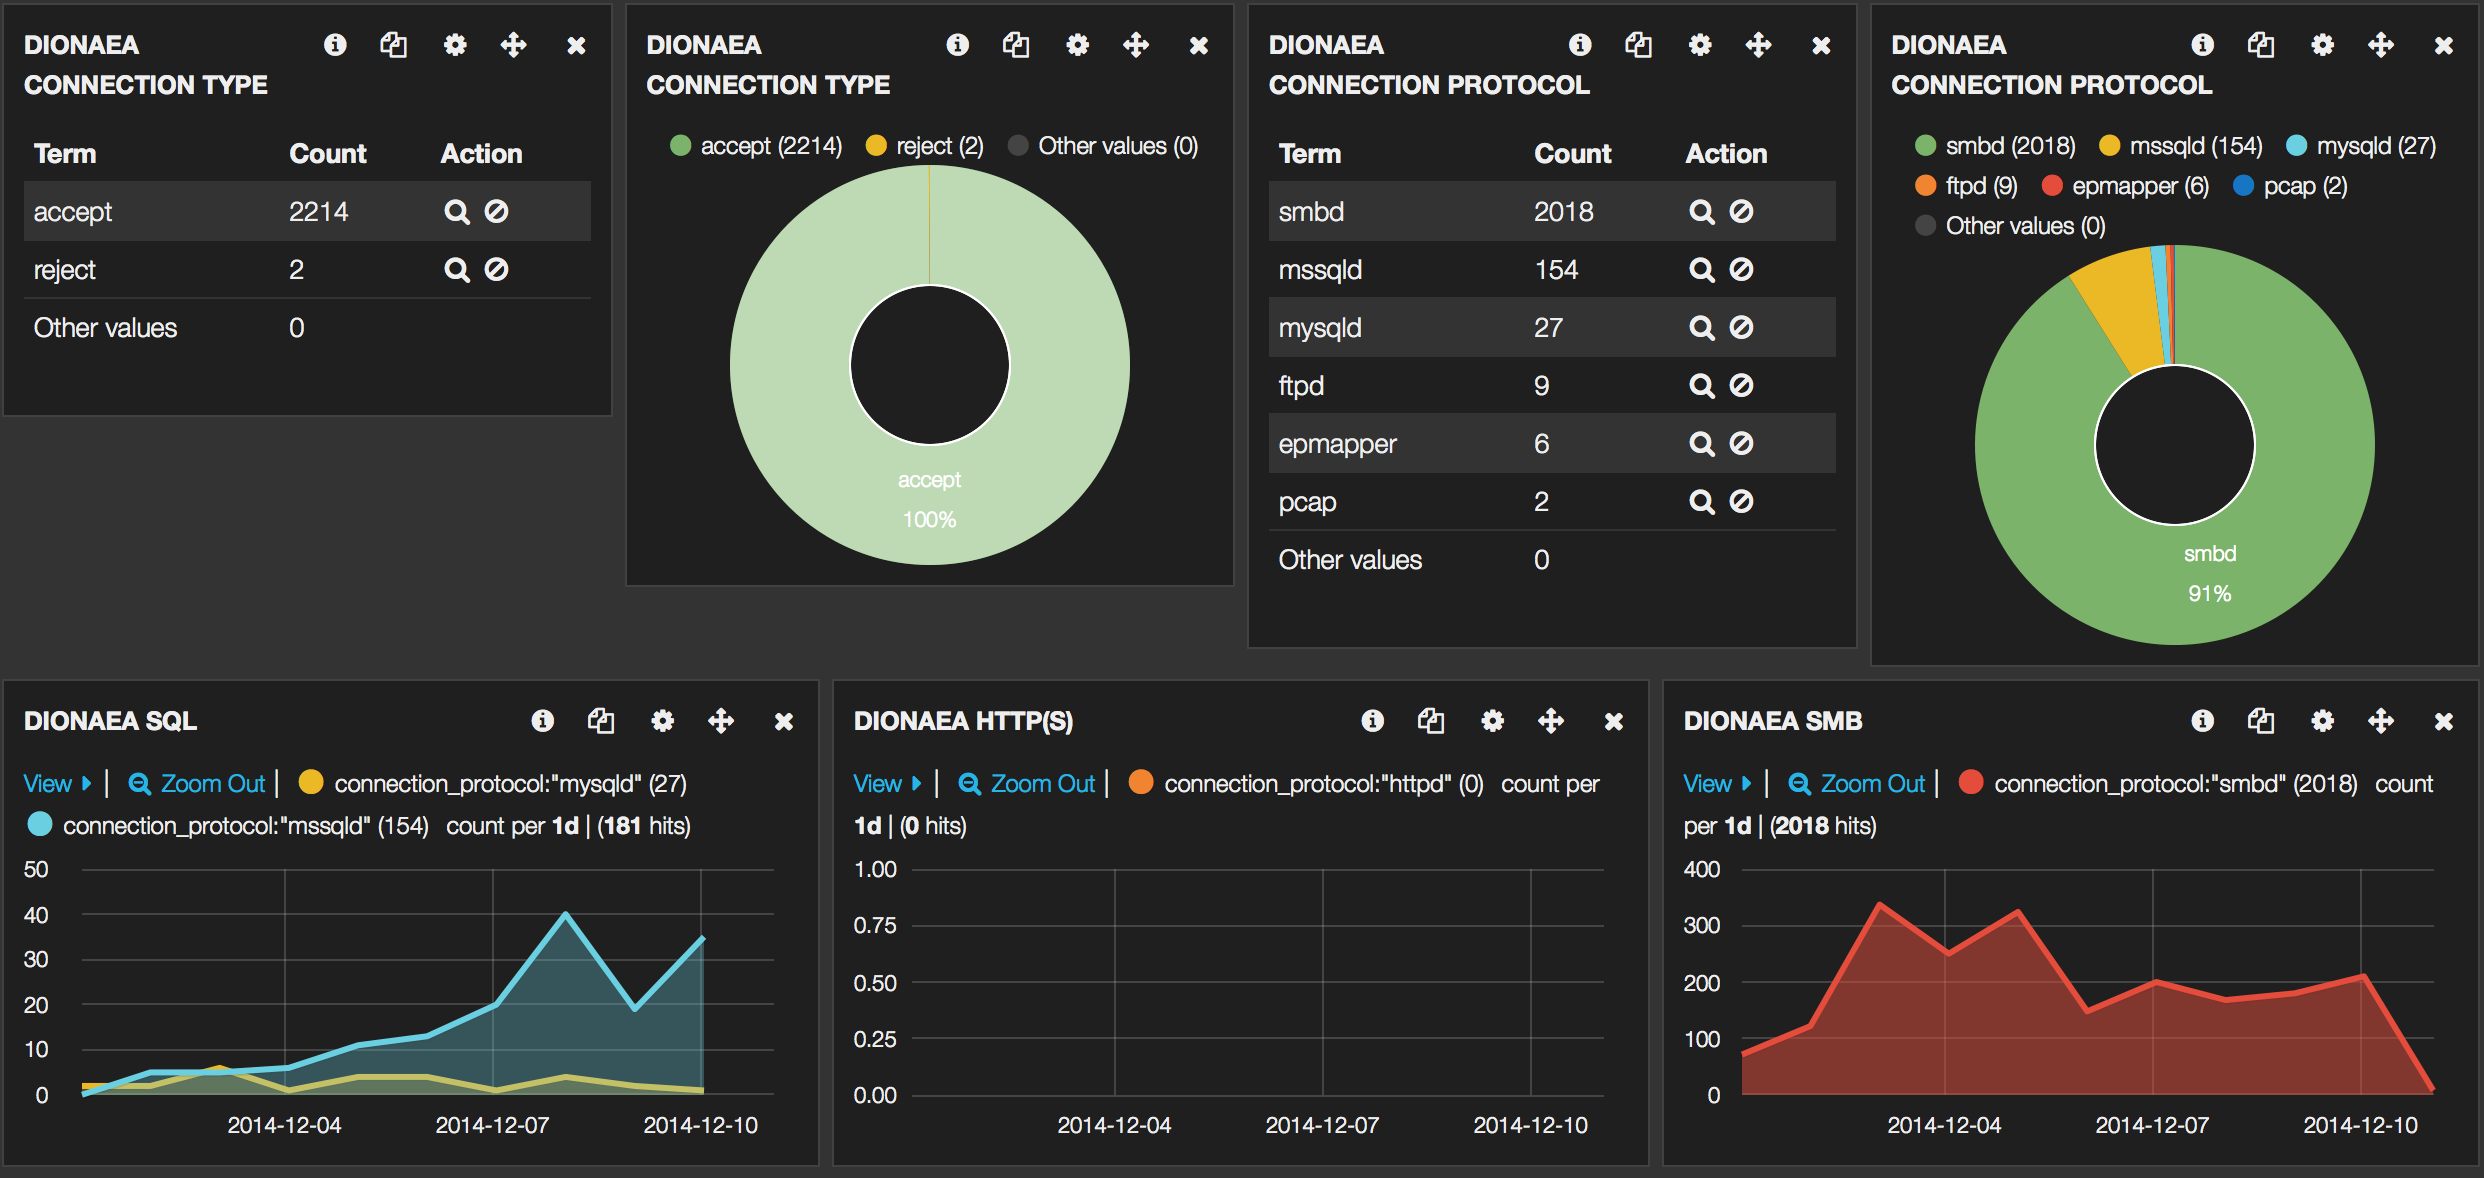
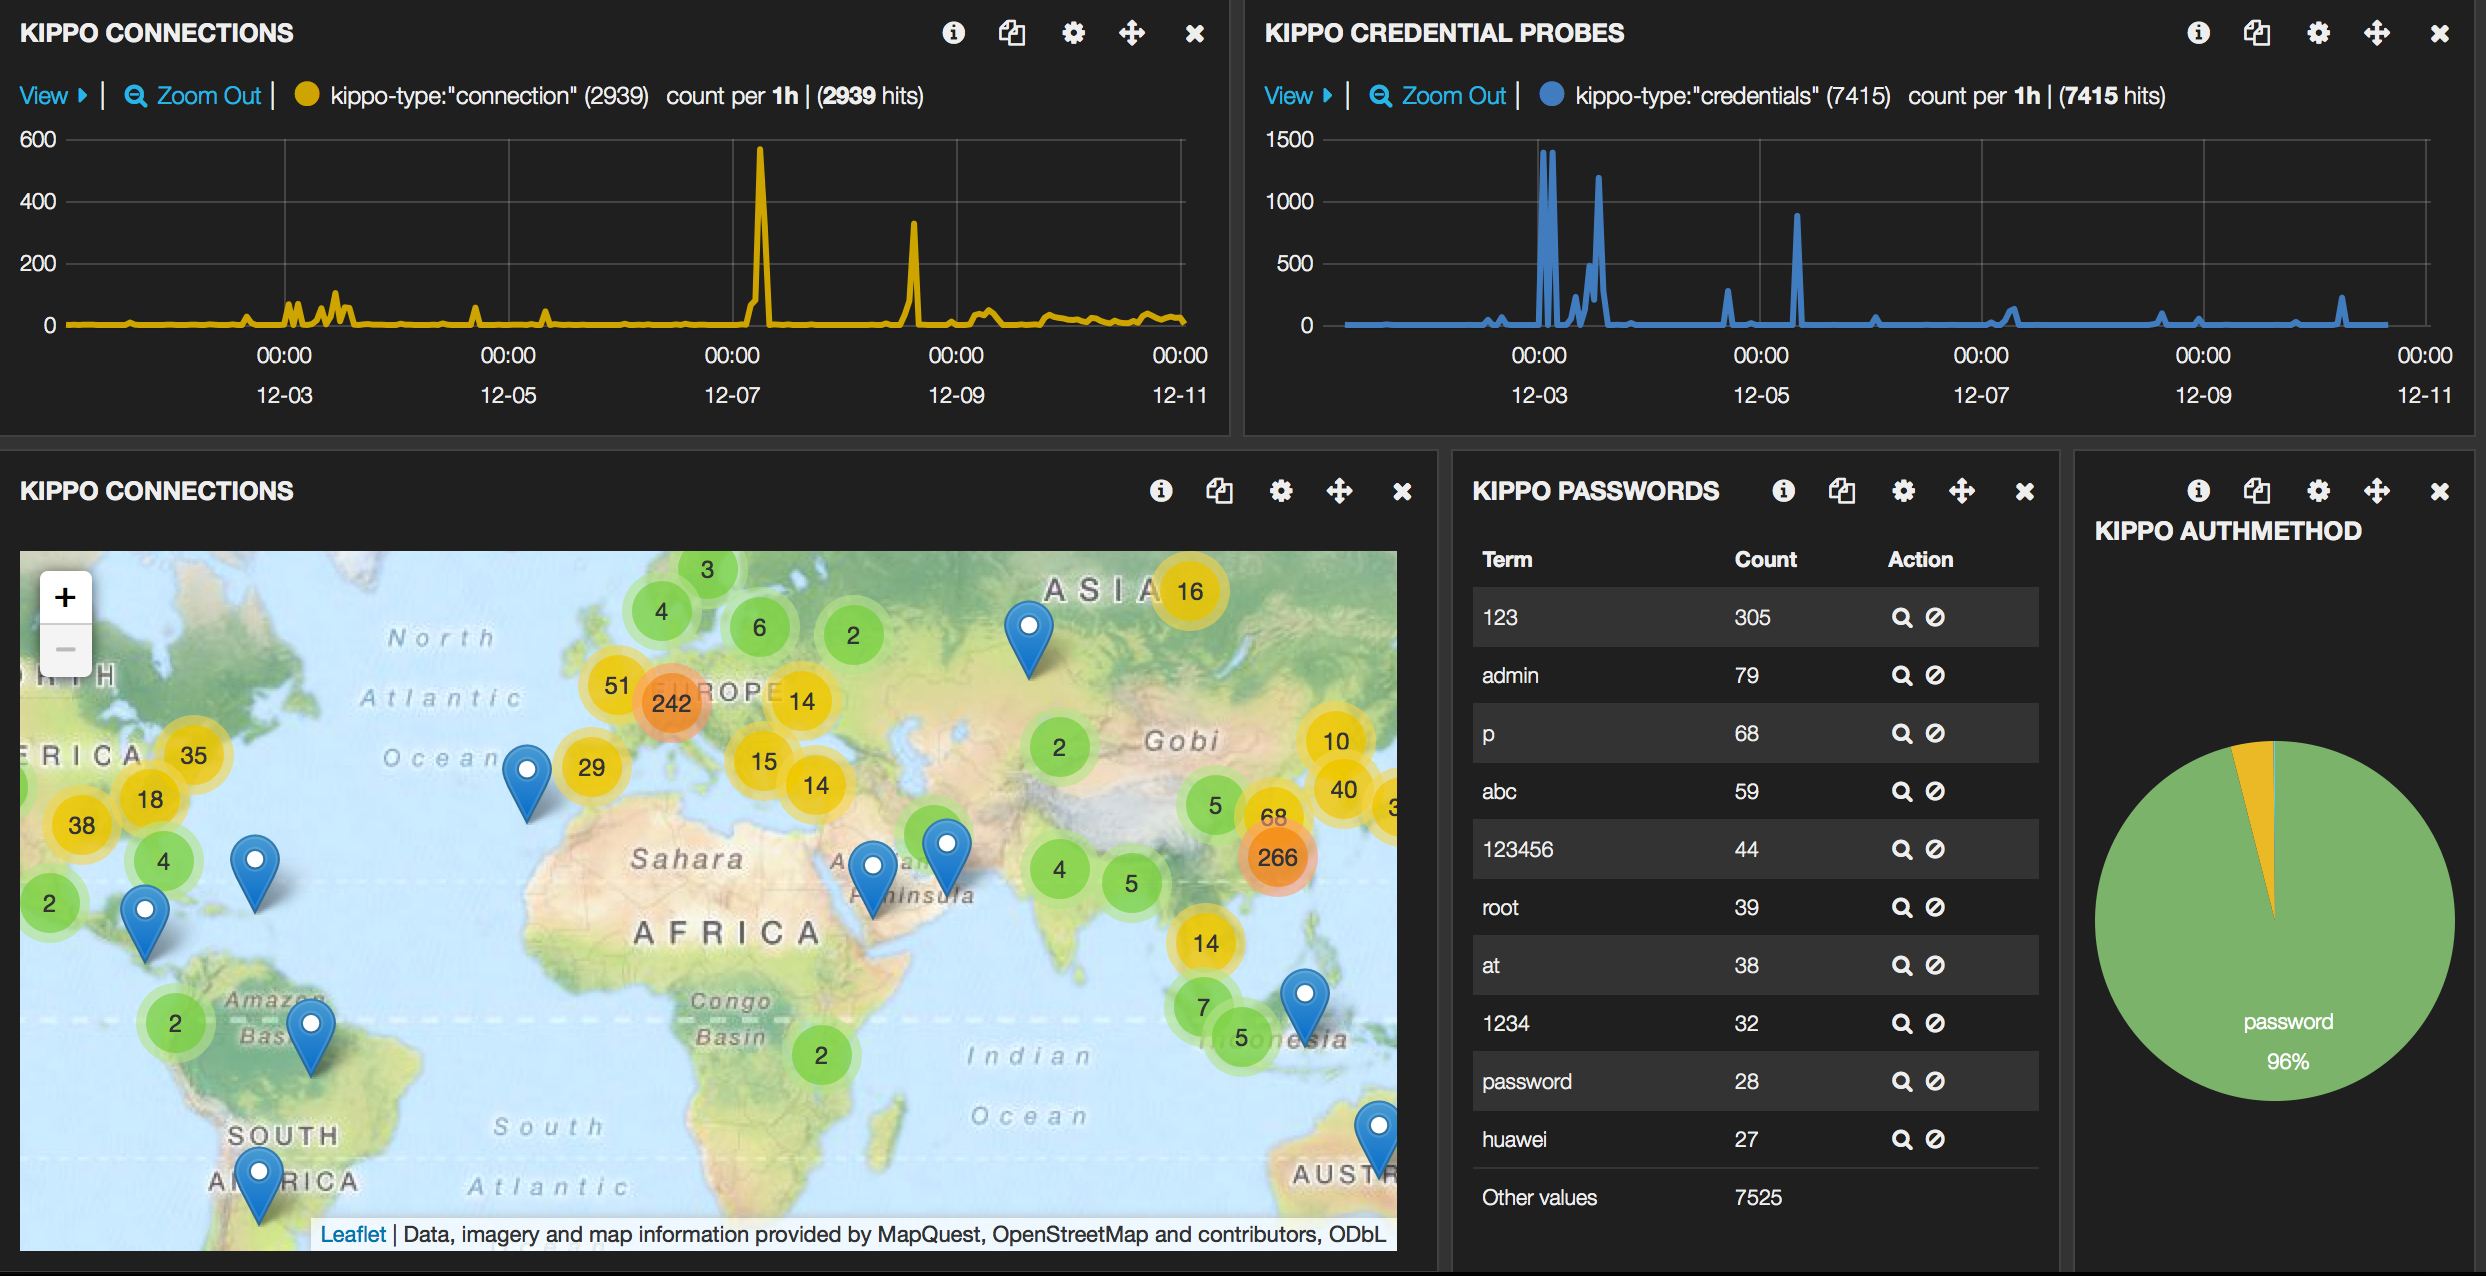
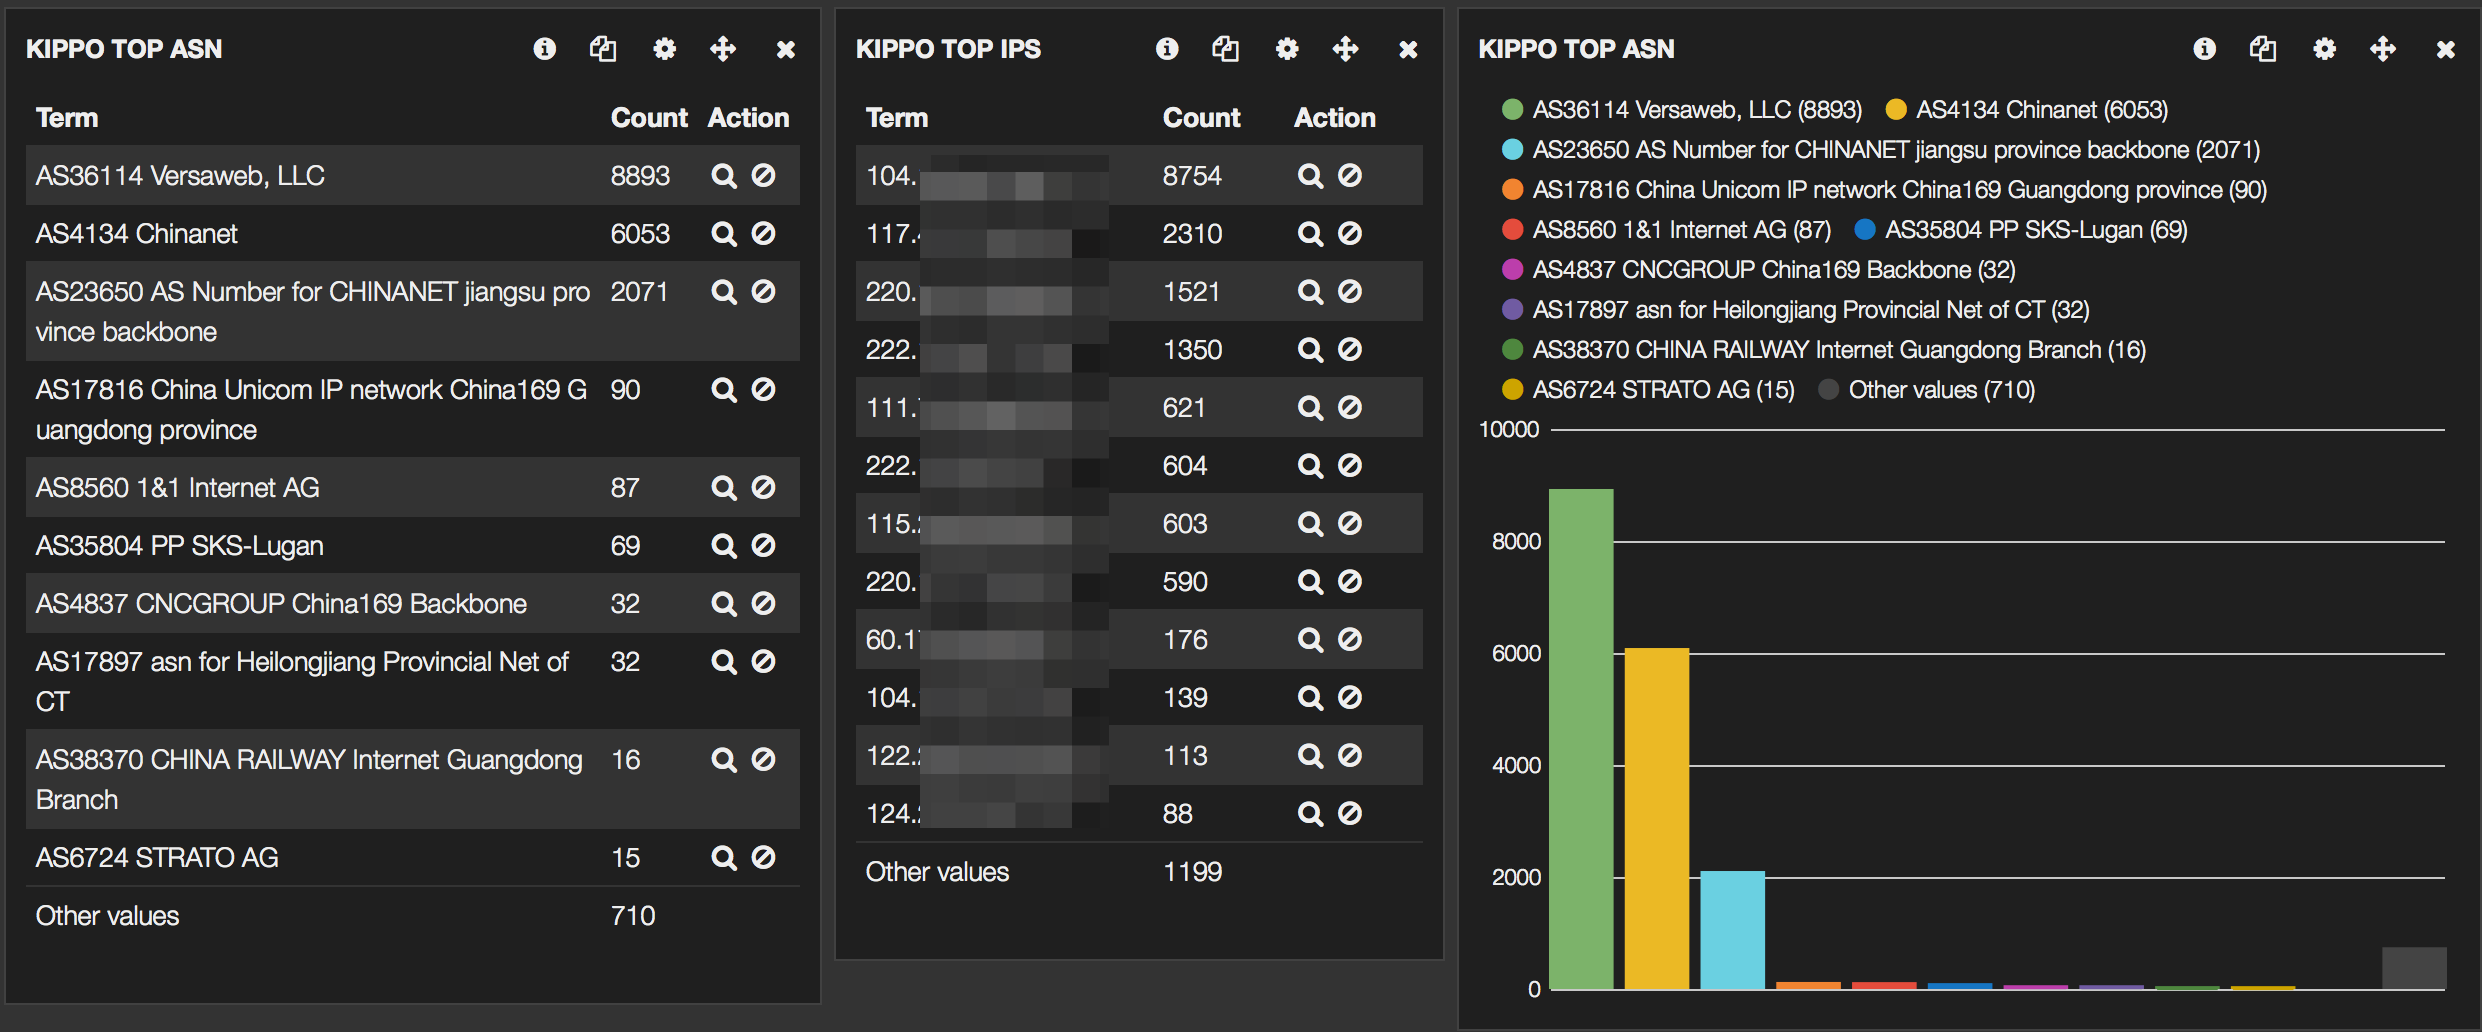
To wet your appetite, some screenshots of the final Kibana interface :
Honeypots
I’ll be using the Kippo, Dionaea, Glastopf and Conpot honeypots. There is a Github page describing how to install, configure and start these honeypots on Ubuntu.
- Kippo (Kippo is a medium interaction SSH honeypot)
- Dionaea (Dionaea is a low-interaction honeypot)
- Glastopf (Glastopf Web Application Honeypot)
- Conpot (Conpot is a low interactive server side Industrial Control Systems honeypot)
The other files referenced in this post (configuration, proxy scripts) can also be found on Github.
Getting the data
ELK primarily gets its data from logfiles. To process the data I used these methods
- Kippo
Kippo logs to a logfile that is fairly easy to process, no changes here; - Dionaea
Dionaea can log to a logfile and a database. I found the logfile cumbersome and not at all easy to parse. So in order to get the data that I need I use some sort of proxy script. This script basically reads the database and adds the entries to a logfile. Note that for Dionaea you lose some of the useful information (like download URLs etc) that are stored in the database. However for a more detailed or ‘zoomed-in’ view to Dionaea I strongly advise to setup DionaeaFR. If you need the extra data in ELK it is fairly easy to adapt the proxy script; - Glastopf
logs to a database. Similarly to Dionaea I used a proxy script to get the data; - Conpot
works similarly to Glastopf so I use an almost identical proxy script to get the data. This script also has the ability to read from a mysql database (set the DB_* options) instead of a sqlite database. You can use similar code to implement the same features for the Glastopf and Dionaea script.
I do not cover any optimization of Logstash or Elasticsearch (indexes etc.).
Database proxy script
The database proxy scripts for Dionaea, Glastopf and Conpot essentially all work in the same way.
- they use a temporary file as a marker to remember what the last read record was;
- a SQL query is done against the database to get all records after the last read record;
- every record is parsed and converted to the correct format;
- the output is then either send to the screen or to a logfile;
- upon completion, the last read record ID is stored in the temporary file.
The three different files need some minor inline configuration
- Dionaea
- SQLITE_DB : location of the sqlite database;
- LAST_CONNECTION_FILE : id of the last record read;
- LOGFILE : where to write the entries; leave this empty to get output to screen.
- Glastopf
- SQLITE_DB : location of the sqlite database;
- LAST_CONNECTION_FILE : id of the last record read;
- LOGFILE : where to write the entries; leave this empty to get output to screen;
- DSTIP : the destination IP of the honeypot DO NOT FORGET to set this one;
- DSTPORT : the destination port of the honeypot DO NOT FORGET to set this one;
- PROTOCOL : the protocol used by the honeypot DO NOT FORGET to set this one.
- Conpot
- SQLITE_DB : location of the sqlite database;
- LAST_CONNECTION_FILE : id of the last record read;
- LOGFILE : where to write the entries; leave this empty to get output to screen;
- DSTIP : the destination IP of the honeypot DO NOT FORGET to set this one;
Ideally you run these scripts from cron every 5 minutes
*/5 * * * * /opt/cudeso-honeypot/elk/dionaea-singlelogline.py
*/5 * * * * /opt/cudeso-honeypot/elk/conpot-singlelogline.py
*/5 * * * * /opt/cudeso-honeypot/elk/glastopf-singlelogline.py
but for testing purposes it’s easier to run them from a terminal and have the output set to the screen (remember to set LOGFILE = “”).
You should also rotate these logs. A sample logrotate script is included. Run the script from cron
25 7 * * * logrotate /opt/cudeso-honeypot/elk/elk-import.logrotate
Logstash configuration
The logstash.conf file in the repository contains entries for parsing the different logfiles.
The four sources in the input section describe the location of the logfiles and assign a unique type for every logfile
The filter section is where the processing is done. The beginning of the filter section contains settings for a specific honeypot type. The last part of the filter section contains general changes that are applied to all entries.
Kippo – Logstash
- some log entries are dropped (mostly because they do not contain useful info);
- three different types of Kippo entries are logged. Remember that you can use these types in Kibana to filter the results. kippo-type =
- credentials : when a combination of username / password is probed;
- authentication-method : what authentication method is tried;
- connection : an established connection to the honeypot.
credentials => kippo-session, srcip, kippo-username, kippo-password
authentication-method => kippo-session, srcip, kippo-username, kippo-authmethod
connection => srcip, srcport, dstip, dstport, kippo-session
Dionaea – Logstash
All connection entries are processed (the proxy script contains a setting to ignore certain IPs from ending up in the log). Remember that download details etc. are not logged by the proxy script.
connection_type, connection_protocol, protocol, srcip, srcport, dstip, dstport, hostname
Glastopf – Logstash
All connection entries are processed.
srcip, srcport, dstip, dstport, protocol, request_url, pattern, filename, request_method, request_raw
Conpot – Logstash
All connection entries are processed.
srcip, srcport, dstip, request_protocol, response_code, sensor_id, request_raw
Changes for all honeypots in Logstash
The last part of the filter section sets a basetype and enriches the data with GeoIP data. You will have to download the Maxmind GeoIP databases and save them in the correct locations.
      database =>"/var/www/db/GeoLiteCity.dat"
...
      database =>"/var/www/db/GeoIPASNum.dat"
If an IP address is found in srcip then coordinates, country codes and AS information will be added to the record.
Logstash
Logstash has to be restarted when you do a configuration change. So after adding the settings above you’ll have to restart Logstash. I use the verbose option to check for errors and warnings. Note that if you want to empty the databases (provided you are using the default logstash-* indexes) you can do (if Logstash is still running) :
curl -XDELETE 'http://localhost:9200/logstash-*'
Stop Logstash and restart it from the Logstash directory with
./bin/logstash --config logstash.conf --verbose
If you get no configuration warnings you can start testing.
Import the data
Instead of immediately starting to import the full logfiles I advise you to start with a couple of sample lines and see if Logstash processes the data properly. Check the logstash output for errors similar to _grokparsefailure.
Also, do not forget that if you run the proxy scripts they will restart from the last processed ID. If you do not delete the temporary file and no new entries are logged then there’s nothing to send to Logstash!
My test sequence often consisted of
- have a database with only a minimal (5 to 10) events
- curl -XDELETE ‘http://localhost:9200/logstash-*’
- stop Logstash
- ./bin/logstash –config logstash.conf –verbose
- rm /tmp/dionaea-singlelogline.id
- /var/honeypots/dionaea-singlelogline.py
- observe the output of logstash
If everything went as expected you can now switch to Kibana. You can also use Kibana to check for errors (see further).
Use the Kibana Honeypot Dashboard
The default Kibana dashboard should already list your data but it’s not very useful yet. So import the Kibana honeypot dashboard.
The first rows of the dashboard represent data for all the honeypots whereas the last rows print the data for the specific honeypots.
Do not change the (pinned or unpinned) pre-defined queries as otherwise some of the panels will no longer function. Use the Filtering to filter the results. For example if you click on one of the honeypot-types you’ll get that type as a specific filter.
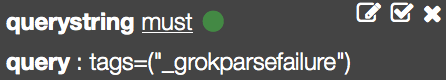
You can use filtering to check for parsing errors by Logstash. Add a new filter and set the query to
tags = ("_grokparsefailure")
Extensions
Feel free to contribute to the repository.
- Add download information from Dionaea;
- Add LaBrea;
- Scripts based on the Inspect to extract source IPs from the honeypots;
- Extend conpot;
- Import ulogd-viz;


Hi Koen, great stuff here, keep it up!
Awesome project!Could you share fully VM file for this project, it’s easy for us to undersand what you did.
Sharing the full VM is not possible … but you should be able to get everything running with the configuration in the github repository.
hi , what about Amuns log files ! is it possible to use it for Amun?
😀 what a question! sorry I am new in honeypot stuff and ELK .thanks for sharing.
sucess export data of kippo + dionaea + glastopf to log files, but can not use you logstash config file to export all data to elasticsearch.
I using elasticsearch-1.6.0, kibana-4.1.1-linux-x86, logstash-1.5.2 and java version “1.8.0_45”.
The process pausing at line: “Logstash startup completed”
Adding pattern {"HAPROXYTCP"=>"%{SYSLOGTIMESTAMP:syslog_timestamp} %{IPORHOST:syslog_server} %{SYSLOGPROG}: %{IP:client_ip}:%{INT:client_port} \\[%{HAPROXYDATE:accept_date}\\] %{NOTSPACE:frontend_name} %{NOTSPACE:backend_name}/%{NOTSPACE:server_name} %{INT:time_queue}/%{INT:time_backend_connect}/%{NOTSPACE:time_duration} %{NOTSPACE:bytes_read} %{NOTSPACE:termination_state} %{INT:actconn}/%{INT:feconn}/%{INT:beconn}/%{INT:srvconn}/%{NOTSPACE:retries} %{INT:srv_queue}/%{INT:backend_queue}", :level=>:info}
Pipeline started {:level=>:info}
Logstash startup completed
Try starting logstash with debug to get some more verbose output.
You can also add a dummy log file to be monitored by logstash. Adding entries to that log should at least give you hints logstash is working or not.
Hi Koen,
I successed PUT all kippo log + glastopf log + dionaea log to elasticsearch 1.6. But I can not use your .JSON file to import to my kibana (v4.1.1). How can I do?
I also have another question: How to use kibana draw separate graph for each type of honeypot? . I mean each type (kippo, glastopg, dionaea)with has it own graph, becase i see you use the same fiedl for all type ex: ipsrc. So we can not draw what ip target to kippo, what ip target to glastopf,… 🙁
The JSON file is meant for Kibana v3; it doesn’t work with Kibana v4. Working on that.
You can filter “per honeypot type” by using the “type” field; it’s a field that’s added when logstash processes the logs and it’s set to the honeypot it’s parsing.
Thank you Koen,
Can you explain clearly by give me an example? here is part of my logstash config file to get dionaea log:
############################################################ # Dionaea # if [type] == "dionaea" { grok { match => { "message" => "%{YEAR:year}-%{MONTHNUM:month}-%{MONTHDAY:day} %{TIME:time} : %{DATA:connection_type}\s*\t %{DATA:connection_protocol}\s*\t %{DATA:protocol} \t %{IP:srcip} \t %{DATA:srcport} \t %{IP:dstip} \t %{DATA:dstport} \t %{DATA:hostname}" } add_field => [ "timestamp", "%{year}-%{month}-%{day} %{time}" ] } date { match => [ "timestamp" , "yyyy-MM-dd HH:mm:ss" ] } #geoip{ # database => ["/opt/geoip/GeoLiteCity.dat"] # source=>"srcip" # } #geoip{ # database => ["/opt/geoip/GeoIPASNum.dat"] # source=>"srcip" # } }I use kibana filter as: “type:kippo” or “type:dionaea”,.. for draw my graph. It is OK now. Thanks 🙂
Another question about kibana with IP show on the map:
With kibana4 it, I can not use geoip field to draw IP location on map. it said that I dont have geo_point field, but i also add geo_point to my config file as the link: https://www.elastic.co/guide/en/elasticsearch/reference/1.6/mapping-geo-point-type.html
############################################################ # Filters to apply on all honeypot data # if ( [type] == "glastopf" or [type] == "dionaea" or [type] == "kippo" ) { mutate { add_field => [ "basetype", "honeypot" ] } geoip { source => "srcip" target => "geoip" database =>"/opt/geoip/GeoLiteCity.dat" add_field => [ "[geo_point]", "%{[geoip][longitude]}" ] add_field => [ "[geo_point]", "%{[geoip][latitude]}" ] } mutate { convert => [ "[geo_point]", "float" ] } geoip { source => "srcip" target => "geoip" database =>"/opt/geoip/GeoIPASNum.dat" add_field => [ "[geoip][full]", "%{[geoip][number]} %{[geoip][asn]}" ] } }Fixxing this problem by ussing correct logstash index syntax:
elasticsearch { host => localhost index => "logstash-honeypot-%{+YYYY.MM.dd}" }Great finding!
Thank you for your idea and python script. It’s very clearly and help me much in my work.Kibana4 is great to draw graph. Here is one graph: http://www.imagebam.com/image/ca19d5422239678
we need a full VM because i have some of non-understanding linux