AWS
Analysing firewall rules in AWS can be complex. There are Security Groups (SG) as well as Access Control Lists (ACL). Security groups are applied on instances and are the first layer of defense, whereas access control lists are applied on network components (subnets) and are a second layer of defense. A major difference is that SGs are stateful, whereas ACLs are stateless. From a filtering perspective there is also a difference. In security groups all rules are applied. In access control lists, the rules are applied in the order that they occur, based on the rule number, meaning that rules with a lower number get processed first.
To make analysing AWS SGs and ACLs easier I wrote two Python scripts that process the data from Amazon and present it in a nice Markdown table. You can find these scripts on GitHub https://github.com/cudeso/tools/tree/master/aws-analyse. In addition to these scripts, I also make use of a tool called aws-security-viz to visualise AWS security groups and make the (security) analysis of an AWS environment easier.
Workflow
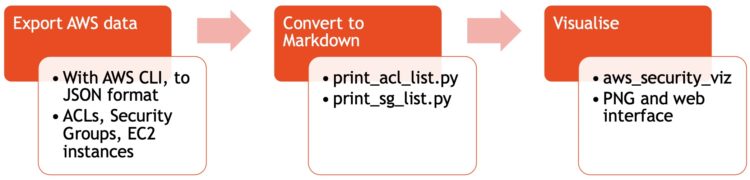
Export data from AWS
I use the AWS CLI to export the data. I need three sets of data
- Access Control Lists;
- Security Groups;
- The list of instances to understand where SGs are applied.
Exporting the data is easy
aws ec2 describe-network-acls --no-paginate > acl_list_life.json
aws ec2 describe-security-groups --no-paginate > all_sg.json
aws ec2 describe-instances --no-paginate > all_instances.json
Optionally you can filter for specific VPCs with “–filters ‘Name=vpc-id,Values=vpc-demoid'” or for specific security groups with “–group-ids <list of SG-IDs space separated>”.
Convert to Markdown
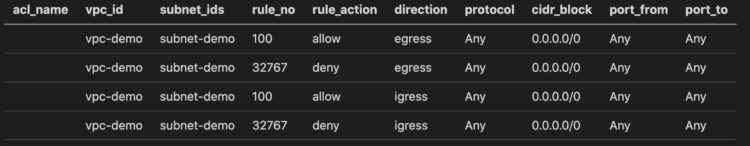
I then use print_acl_list.py to convert the data from acl_list_life.json to a Markdown table. This gives me the firewall rules applied on the subnets.
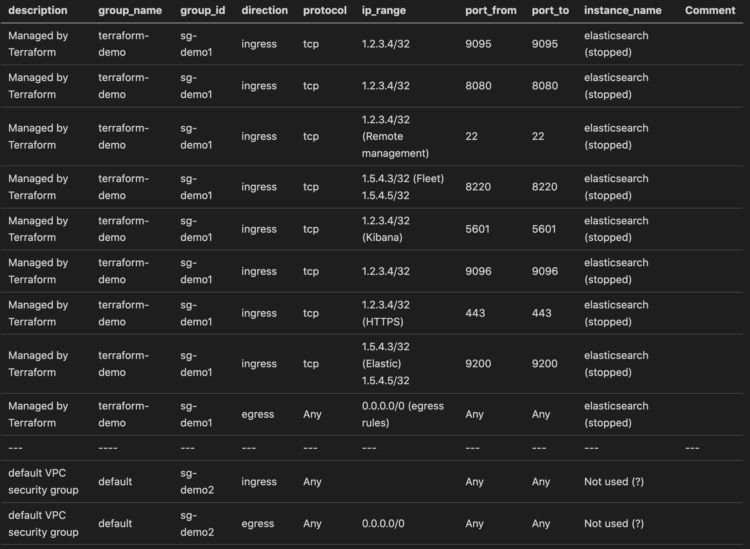
Then I use print_sg_list.py to convert the data from all_sg.json into a Markdown table as well. This script also needs the export of the instances (from all_instances.json) to link the security groups with the instances.
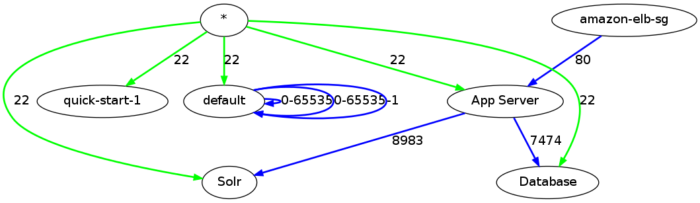
Visualise
The third step is then to use aws_security_viz to convert the output from the security groups to an image (‘network diagram’). Unfortunately this only works for security groups, it does not work for access control lists.
aws_security_viz -o all_sg.json -l -f all_sg.png -c opts.yml
(from https://github.com/anaynayak/aws-security-viz)
Instead of a static image, aws_security_viz can also represent the data in a web page. You start the build-in webserver with
aws_security_viz -o all_sg.json -f nav_all_sg.json -c opts.yml -l -n navigator --serve=3000
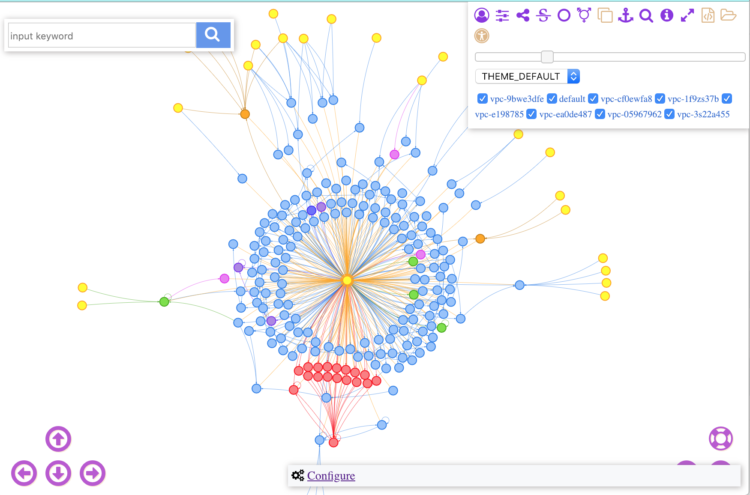
(from https://github.com/anaynayak/aws-security-viz)
The configuration file opts.yml allows you to group certain subnets together, or to give more meaningful names to network objects.
---
:format: dot
:egress: true
:groups:
  '1.2.3.4/32': 'Demo Host'
  '1.5.4.3/24': 'Remote Subnet'
Conclusion
These scripts aren’t perfect (do a PR to improve them) but they give me the information that I need in an easy to use format. The Markdown tables together with the visualisations make for a good analysing / reporting approach. Obviously you can link the entire chain together and automate the process. Note that there are commercial tools available that provide similar results, but this approach is sufficient (and free) for my needs.


I’m receiced error while using your python script,
json.decoder.JSONDecodeError: Expecting value: line 1 column 1 (char 0)