MISP to Microsoft Sentinel integration with Upload Indicators API

MISP to Microsoft Sentinel integration

The MISP2Sentinel integration allows you to sync indicators from MISP to Microsoft Sentinel. The old integration relied on the Microsoft Graph API. Microsoft prefers new integrations to rely on the Upload Indicators API. The new MISP to Microsoft (previously Azure) Sentinel or misp2sentinel does just that, it

  • Supports integration with the old Graph API, but also
  • It supports the new, and preferred, Upload Indicators API.

Installation and configuration

Read the installation and configuration documentation at https://github.com/cudeso/misp2sentinel for more details. Additional details are also available via the MISP website (https://www.misp-project.org/2023/08/26/MISP-Sentinel-UploadIndicatorsAPI.html/).

STIX

The Upload Indicators API of Microsoft is STIX based. STIX is a structured language for describing threat information to make sharing information between systems easier. This integration relies on the MISP-STIX library to handle the conversion between MISP and STIX.


Microsoft Azure Market Place

The misp2sentinel solution is in the Market Place or Microsoft Sentinel Content Hub with a corresponding data connector. Note that enabling the solution in Azure isn’t sufficient to sync indicators. You still need to setup the Python environment or use the Azure Function.


MISP to Sentinel integration

MISP to Sentinel integration

I published a blog article on the MISP project website on how to do the MISP to Azure / Sentinel integration. This integration allows you to upload indicators from MISP to Microsoft Sentinel. It relies on PyMISP to get indicators from MISP and an Azure App and Threat Intelligence Data Connector in Azure.

Read the full article at MISP project website : MISP to Sentinel integration.

The integration is available via GitHub at https://github.com/cudeso/misp2sentinel

This repository is started from the Microsoft Graph Security API GitHub repository. Because the Microsoft repository seems no longer maintained a separate repository was started, stripped of the non-MISP items and with updated Python code. Compared to the original Microsoft repository, this now includes

  • Handle attributes in objects
  • Handle URLs that do not have http/https included
  • Handle network direction (network_ignore_direction)
  • Adjust logging – verbosity
  • Ignore local tags (misp_ignore_localtags)
  • Properly deal with tags on attribute level
  • Add defaultConfidenceLevel
  • Add sentinel-threattype
  • Convert KillChain labels for Azure

Migrating your MISP database from a local MySQL to Azure Database for MySQL

MISP database

Introduction

In most MISP instances the database (MySQL or MariaDB) is on a local network, either directly on the machine or on a local DB-cluster. As a lot of organisations are moving towards a “full cloud” environment, this also means that they want to start making use of the database features offered by their cloud providers.

Microsoft offers Azure Database for MySQL and in this post I list the (limited) steps required to migrate the MISP database from a local instance to a cloud instance.

In this post I also assume you already have MISP installed with a local database. Even for new installs that already decided to use a cloud database, I first install it with a local database, and then move that local database to the cloud db.

Azure Database for MySQL

The provisioning of an Azure Database for MySQL is already described by Microsoft at https://learn.microsoft.com/en-us/azure/mysql/single-server/quickstart-create-mysql-server-database-using-azure-portal. Do not forget to set a firewall rule to allow access from your MISP instance to the cloud database.

Export and import the database

Exporting and importing a mysql database is fairly straightforward with mysqldump. The below command will export the database ‘misp’ to a file ‘/root/misp_dump.sql’.

mysqldump -u root -p misp > /root/misp_dump.sql

In order to access the cloud DB you need to force it to use SSL. Download the CA file and place it in your MISP directory (you also need it in the next step).

wget --trust-server-names --no-check-certificate  https://dl.cacerts.digicert.com/DigiCertGlobalRootCA.crt.pem
cp DigiCertGlobalRootCA.crt.pem /var/www/MISP/
chown www-data:www-data /var/www/MISP/DigiCertGlobalRootCA.crt.pem

Next we need to create the MISP database and user in the cloud DB. Add the database, the user and assign the user the correct permissions. Replace 1.2.3.4 with the IP address of your MISP server and replace misppassword with a strong MISP DB password.

mysql -u root -h misp.mysql.database.azure.com -p '--ssl-ca=/var/www/MISP/DigiCertGlobalRootCA.crt.pem'

create database misp;

create user 'misp'@'1.2.3.4' identified by 'misppassword';
grant usage on *.* to 'misp'@'1.2.3.4';
grant all privileges on misp.* to 'misp'@'1.2.3.4';
flush privileges;

Note that your actions in the mysql CLI are logged in .mysql_history. Because the history file will also contain the misp database user password it might be useful to overwrite the history file (echo > ~/.mysql_history).

You can now import the previously created database dump into the cloud DB.

mysqldump -u root -p misp < /root/misp_dump.sql

If you no longer require this file then do not forget to remove the database dump!

MISP database configuration

The main MISP database configuration is in /var/www/MISP/app/Config/database.php. Compared to a locally hosted version you will have to change the host and add the CA reference. If you have used a different combination of username/password then obviously you also have to update those settings.

<?php
  class DATABASE_CONFIG {
          public $default = array(
                  'datasource' => 'Database/Mysql',
                  'persistent' => false,
                  'host' => 'misp.mysql.database.azure.com',
                  'login' => 'misp',
                  'port' => 3306, // MySQL & MariaDB
                  'password' => 'misppassword',
                  'database' => 'misp',
                  'prefix' => '',
                  'encoding' => 'utf8',
		  'ssl_ca' => '/var/www/MISP/DigiCertGlobalRootCA.crt.pem',
          );
  }

If your MISP error logs return

'SQLSTATE[HY000] [3159] Connections using insecure transport are prohibited while --require_secure_transport=ON.',

then this means that the web server is unable to read the CA file. Make sure that you have updated the file permissions so that the web user can read the file.

A well-tuned database (innodb-) configuration can greatly improve the performance of MISP. Some of the settings that you normally configure in a “traditional” database server are now handled automatically by Azure. This concerns for example innodb_buffer_pool_size, innodb_io_capacity and innodb_read_io_threads. And although the Azure deployment provides already sane defaults, it can be useful to tweak (increase) these settings. Just be aware that a change sometimes requires a redeployment, and hence a downtime of the database, and MISP.

Personal notes

I’m not a big fan of using cloud provided MySQL services for MISP. In my experience it is fairly slow (‘network’, and at least for the low end options – this can also be related to my limited knowledge on how to setup cloud resources at Azure) and you introduce an extra external component / dependency. Obviously you can throw more money at it to make it go faster. But then why not spend that money on more resources for your MISP instance/cluster and limit the number of external dependencies?

Include threat information from MISP in Zeek network visibility

Zeek

Zeek (formerly Bro) is a free and open-source software network analysis framework. It gives insights on DNS queries, HTTP and TLS information and details on transmitted files. I find Zeek one of the best network monitoring tools available to provide detailed visibility on network traffic.

Zeek has a built-in intelligence framework. This framework allows you to add information received via MISP directly into the network visibility capabilities of Zeek. This includes

  • Visits to URLs or domains that are included in MISP events;
  • Network requests to IPs that exist as attributes in MISP events;
  • Download of files that match with hashes described in MISP events.


Workflow

My workflow consists of these steps:

  1. Export MISP information in a format readable by Zeek. The MISP server is not accessible by the host running Zeek;
  2. Copy the exported information to a transfer host;
  3. The host running Zeek picks up the information from this transfer host;
  4. Matches are captured in a log file and this log file is pushed to a transfer host, where it is picked up by a visualisation host.


Export MISP to Zeek

The first step involves exporting the MISP information in a format that is readable by Zeek. I created a Python script that queries MISP for events changed in the last 30 days, excludes events with specific tags and stores the attributes in a correct Zeek format. See the GitHub repository cudeso/misp_to_zeek.

First create an API key. In MISP you can do this via Global Actions, My Profile and then click on Auth keys. Add a new key via Add authentication key and give it a meaningful name. Because the script does not need to manipulate data, it’s best to set it to read-only. The script runs locally so access is limited to localhost (127.0.0.1).


Next, on the MISP server clone the GitHub repository, create the keys.py file and edit this file. This keys.py file holds the API key and the URL that points to your MISP server.

git clone https://github.com/cudeso/misp_to_zeek
cd misp_to_zeek
cp keys.py.default keys.py
misp_url = "https://misp"
misp_key = "secret_api_key"
misp_verifycert = False

The Python script only requires the Python requests library. You can tune the execution of the script by changing the variable misp_config.

misp_config = { "last": "30d", "to_ids": 1 , "enforceWarninglist": 1, "tags": [ "!tlp:red" ]}

In this example

  • last:30d : The information changed in the last 30 days is fetched;
  • to_ids:1 : Only those attributes that have the to_ids (‘actionable’) flag set are taken into account;
  • enforceWarninglist:1 : Any matches with warninglists are excluded;
  • tags: “!tlp:red” : All TLP:RED information is excluded. You can add additional tags to include or exclude information.

Add a cronjob to execute the script together with the secure copy.

00 5,9,13,17  * * * cd /home/misp/misp_to_zeek/ ; python3 /home/misp/misp_to_zeek/update_intel.py ; scp -i /home/misp/misp_to_zeek/sshkey.private /home/misp/misp_to_zeek/misp-*.intel upload_user@transfer:/transfer/misp_to_zeek/

The Python script generates files that start with misp- and end with .intel. These ‘intel’
files contain the MISP attributes in a format that Zeek understands.


Transfer host

The configuration of the transfer host is straightforward. This host allows secure file transfer with public/private key access from a limited set of devices and users. The transfer host does not initiate new connections.

Install Zeek

Finally, on the host that is running Zeek I also clone the GitHub repository, but this time I do this in the location where Zeek is installed.

cd /opt/zeek/share/zeek/site/
git clone https://github.com/cudeso/misp_to_zeek
cd misp_to_zeek

The files __load__.zeek and main contain the configuration that is needed for the Zeek intelligence framework to include the MISP information. In __load__.zeek we instruct Zeek to load all settings from main, which is the list of “Intel” files.

##! Load Intel Framework
@load policy/integration/collective-intel
@load policy/frameworks/intel/seen
@load policy/frameworks/intel/do_notice
redef Intel::read_files += {
	"/opt/zeek/share/zeek/site/misp_to_zeek/misp-domain.intel",
    "/opt/zeek/share/zeek/site/misp_to_zeek/misp-hostname.intel",
    "/opt/zeek/share/zeek/site/misp_to_zeek/misp-ip-dst.intel",
    "/opt/zeek/share/zeek/site/misp_to_zeek/misp-ip-src.intel",
    "/opt/zeek/share/zeek/site/misp_to_zeek/misp-ja3-fingerprint-md5.intel",
    "/opt/zeek/share/zeek/site/misp_to_zeek/misp-md5.intel",
    "/opt/zeek/share/zeek/site/misp_to_zeek/misp-sha1.intel",
    "/opt/zeek/share/zeek/site/misp_to_zeek/misp-sha256.intel",
    "/opt/zeek/share/zeek/site/misp_to_zeek/misp-sha512.intel",
    "/opt/zeek/share/zeek/site/misp_to_zeek/misp-url.intel"
};

Then change the Zeek configuration in /opt/zeek/share/zeek/site/local.zeek to include the intelligence files and set the logging configuration to JSON format. The logs are send to an Elastic host and JSON makes parsing the logs much more easier.

# Output to JSON format
@load policy/tuning/json-logs.zeek

# Include MISP
@load misp_to_zeek

As a last step add a cron job that fetches the intel files from the transfer host and deploys the new settings (intel files) to Zeek.

/opt/zeek/bin/zeekctl deploy

Zeek logs matches to /opt/zeek/logs/current/intel.log and because the log format is set to JSON this is easy to read/parse.

{
	"ts": 1673518745.662658,
	"uid": "CZ2lksFrAiip3gF7a",
	"id.orig_h": "192.168.0.1",
	"id.orig_p": 38203,
	"id.resp_h": "192.168.0.2",
	"id.resp_p": 53,
	"seen.indicator": "__redacted__.com",
	"seen.indicator_type": "Intel::DOMAIN",
	"seen.where": "DNS::IN_REQUEST",
	"seen.node": "zeek",
	"matched": ["Intel::DOMAIN"],
	"sources": ["OSINT - IOCs (event ID 93042)"]
}

Visualisation

The visualisation of the Zeek information and alerts is done with Elastic and the Filebeat module for Zeek. Unfortunately (at least in the v7) the module does not include a visualisation for the “intel” files. I added minor visualisation extensions by filtering on the intel data set and then creating visualisations for matched intel, matched intel types, source MISP events and number of occurrences.

event.dataset :"zeek.intel"

The alerting is then done via Elastalert.

Conclusion

Zeek is a simple a great tool to monitor your network traffic. It’s complementary to Suricata, which is more aimed to signature-based detection. In this case, the monitoring host cannot run both Suricata and Zeek. Adding the “intel” detection to Zeek gives sufficient alerting if there’s activity matching a known threat event.

Note that there is also Dovehawk which allows you to send sightings back to MISP. Although MISP sightings are very useful, this approach with Dovehawk was not possible in my setup.

ENISA Threat Landscape 2022

ENISA Threat Landscape 2022

I contributed to the ENISA Threat Landscape 2022. The ETL is an annual report on the status of the cybersecurity threat landscape. It identifies the top threats, major trends observed with respect to threats, threat actors and attack techniques, as well as impact and motivation analysis. It also describes relevant mitigation measures.

Get a copy of the ENISA Threat Landscape 2022.

CTI-Summit 2022 Luxembourg Presentations

CTIS

The first edition of the Cyber Threat Intelligence Summit took place in Luxembourg in October 2022. I did two presentations:

  • One presentation on MISP web scraper, a tool to create MISP events and reports from scraped websites;
  • and one presentation on building CTI Operational Procedures with Jupyter Notebooks and PyMISP.

The slides and recording are available on GitHub and Youtube.

Down the Chainsaw path to analyse Windows Event logs

Chainsaw

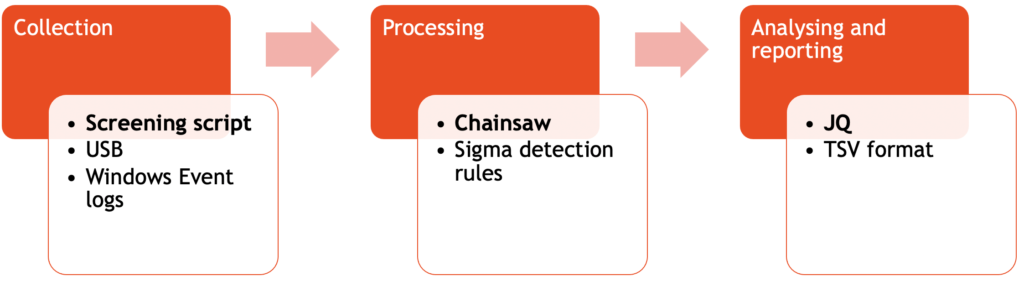
Chainsaw is a tool to rapidly search through large sets of Windows Event logs. In this post I briefly go through the steps that I take to collect, process and analyse logs from different Windows machines and then use them for analysing Windows Event logs. Obviously it’s always better to use centralised logging and apply your detection techniques centrally but unfortunately this isn’t always possible.

Installation

Although Chainsaw is available as a binary package I compile it from source.

git clone https://github.com/countercept/chainsaw.git
cd chainsaw
cargo build --release

After compilation you can find the binary in target/release.

./chainsaw -h

Detection rules

Older versions of Chainsaw included the detection rules as sub packages but now you need to add these yourself. It’s a one step process, you just need to clone the Sigma repository.

git clone https://github.com/SigmaHQ/sigma.git

Now that the environment is configured, it’s time to collect and process the logs.

Collect and process Windows Event logs

Collect the Windows Event logs

I use a small audit screening script (available on GitHub) that not only collects Windows Event logs, it also does live forensics. For the purpose of this post, you only need these lines to collect the logs.

set script_dir=%~dp0
set aud_dir=%script_dir%audit_%COMPUTERNAME%
mkdir %aud_dir%
cd %aud_dir%

xcopy /E/H/C/I "%SystemRoot%\System32\Winevt\Logs" logs

As a side note: I run the entire script from clean (formatted per system) USB keys on the target systems. The live forensic data is then afterwards analysed on a “master” system. Using Chainsaw is just one of the steps in this analysis.

Process the Windows Event logs

Processing the logs can be done in two ways,

  • Either you search for a specific string or event ID;
  • or, you run the detection rules against the event logs and hunt for anomalies.

Searching is useful if you already know what you’re looking for. For example listing the user authentication actions, filtering for processes that have started or tracking when systems have been locked (event ID 4800) or unlocked. I use these options when searching with Chainsaw:

  • –json and –output to have JSON formatted output to a file;
  • With -t you specify a tau expression to search for.
./chainsaw search --json -t 'Event.System.EventID: =4800' ~/screening/audit_system1/logs/* --output ~/screening/audit_system1/processed_search_4800.json

And although the search function is very flexible, the real power of Chainsaw lies in applying the various detection rules against your dataset. To do this you have to start it with the hunt keyword and provide these parameters:

  • –json and –output to have JSON formatted output to a file;
  • –mapping refers to the mapping file included in the Chainsaw repository to link Sigma rules to the Event logs;
  • –sigma points to the earlier cloned repository with the Sigma rules. Make sure you point it to the rules directory in that repository;
  • The final parameter points to the Windows Event log. You can specify one file, or multiple files at once. If you run the detection against multiple log files of different types (channels) then verify that an alert for an Event ID is relevant for that log file. For example the Event ID 100 exists in IIS, DNS and the Certificate Service but has a different meaning depending on its log source.
./chainsaw hunt --json --output ~/screening/audit_system1/processed_hunt.json --mapping ../../mappings/sigma-event-logs-all.yml --sigma ../../../sigma/rules/ ~/screening/audit_system1/logs/*

Analysing the Windows Event logs

The results of hunting with Chainsaw are JSON files with the matches for the detection rules. Generally there are two types of matches: either an individual match or aggregates of a match. In the JSON file they are represented as follows

  {
    "group": "Sigma",
    "kind": "individual",
    "document": {
      "kind": "evtx",
      "data": {

  {
    "group": "Sigma",
    "kind": "aggregate",
    "documents": [
      {
        "kind": "evtx",
        "data": {

In order to make the resulting JSON file a bit more human readable, I use JQ to format the output.

cat ~/screening/audit_system1/processed_hunt.json | jq . > ~/screening/audit_system1/processed_hunt-format.json

Manually going through the JSON result files is doable when there are not that many matches. In most cases though this is very time consuming. In a next step I rely again on JQ to filter out the fields that I care about. I use the result as the first indication of elements that require further inspection. The fact that you can format the output with JQ in a table format also makes it directly usable for reports (here output via JQ to TSV is used, but you can also use output to CSV).

There are two big “blocks” in the JSON event per detection. One refers to the actual event data (available via .document.data.Event.EventData) and another block referring to the system data (available via .document.data.Event.System). EventData contains the more specific information, whereas System holds the timestamp and device information.

cat ~/screening/audit_system1/processed_hunt-format.json | jq -r '.[] 
| {name, eventid:.document.data.Event.System.EventID,timestamp, computer:.document.data.Event.System.Computer,process:.document.data.Event.EventData.ProcessName, user:.document.data.Event.EventData.TargetUserName} 
| [.timestamp,.computer,.eventid,.name,.process,.user] 
| @tsv'
2022-04-28	MYSERVER	4616	Unauthorized System Time Modification	D:\\usr\\file.exe
2022-04-28	MYSERVER	4625	Account Tampering - Suspicious Failed Logon Reasons	D:\\Program Files\\file.exe	Services
2022-04-28			Multiple Users Failing to Authenticate from Single Process
2022-05-03	MYSERVER	4692	DPAPI Domain Master Key Backup Attempt

(output trimmed and redacted)

Now, depending on what I get as initial results, there might be a need to add additional fields to the output.

cat ~/screening/audit_system1/processed_hunt-format.json | jq -r '.[] | {name, eventid:.document.data.Event.System.EventID,timestamp, 
computer:.document.data.Event.System.Computer,
process:.document.data.Event.EventData.ProcessName, 
user:.document.data.Event.EventData.TargetUserName,
rulename:.document.data.Event.EventData.RuleName, 
remote:.document.data.Event.EventData.RemoteAddresses,
path:.document.data.Event.EventData.Path} 
| [.timestamp,.computer,.eventid,.name,.process,.user,.rulename,.remote,.path] 
| @tsv'

Conclusion

The approach of collecting the logs with screening script and then analysing them with a combination of Chainsaw, Sigma and JQ is sufficient for me to get a first view on what has happened on specific devices. There is still a bit of manual post-processing work and all depends on the Sigma rules that are applied, but in general this approach works quite well and has provided me a lot of valuable results.

MISP web scraper

MISP web scraper

I published an article on the MISP project website on the MISP web scraper.

There are a lot of websites that regularly publish reports on new threats, campaigns or actors with useful indicators, references and context information. Unfortunately only a few publish information in an easily accessible and structured format, such as a MISP-feed. As a result, we often find ourself manually scraping these sites, and then copy-pasting this information in new MISP events. These tedious tasks are time-consuming and certainly not the most interesting aspect of CTI-work.

MISP-scraper is a Python script that

  • Parses RSS feeds;
  • Extracts the URLs from these feeds;
  • Creates a MISP event for each URL. If the combination “event-URL” already exists then the event creation is skipped;
  • Adds a MISP report (with the content of the URL) to the MISP event;
  • And then uses the report feature to extract indicators and context from the web page;
  • It is also possible to manually add URLs and outdated events are automatically deleted.

You can find MISP scraper on Github via https://github.com/cudeso/misp-scraper.

Analysing Amazon AWS security groups and access control lists

AWS

Analysing firewall rules in AWS can be complex. There are Security Groups (SG) as well as Access Control Lists (ACL). Security groups are applied on instances and are the first layer of defense, whereas access control lists are applied on network components (subnets) and are a second layer of defense. A major difference is that SGs are stateful, whereas ACLs are stateless. From a filtering perspective there is also a difference. In security groups all rules are applied. In access control lists, the rules are applied in the order that they occur, based on the rule number, meaning that rules with a lower number get processed first.

To make analysing AWS SGs and ACLs easier I wrote two Python scripts that process the data from Amazon and present it in a nice Markdown table. You can find these scripts on GitHub https://github.com/cudeso/tools/tree/master/aws-analyse. In addition to these scripts, I also make use of a tool called aws-security-viz to visualise AWS security groups and make the (security) analysis of an AWS environment easier.

Workflow


Export data from AWS

I use the AWS CLI to export the data. I need three sets of data

  • Access Control Lists;
  • Security Groups;
  • The list of instances to understand where SGs are applied.

Exporting the data is easy

aws ec2 describe-network-acls --no-paginate > acl_list_life.json
aws ec2 describe-security-groups --no-paginate > all_sg.json
aws ec2 describe-instances --no-paginate > all_instances.json

Optionally you can filter for specific VPCs with “–filters ‘Name=vpc-id,Values=vpc-demoid'” or for specific security groups with “–group-ids <list of SG-IDs space separated>”.

Convert to Markdown

I then use print_acl_list.py to convert the data from acl_list_life.json to a Markdown table. This gives me the firewall rules applied on the subnets.


Then I use print_sg_list.py to convert the data from all_sg.json into a Markdown table as well. This script also needs the export of the instances (from all_instances.json) to link the security groups with the instances.


Visualise

The third step is then to use aws_security_viz to convert the output from the security groups to an image (‘network diagram’). Unfortunately this only works for security groups, it does not work for access control lists.

aws_security_viz -o all_sg.json -l -f all_sg.png -c opts.yml


(from https://github.com/anaynayak/aws-security-viz)

Instead of a static image, aws_security_viz can also represent the data in a web page. You start the build-in webserver with

aws_security_viz -o all_sg.json -f nav_all_sg.json -c opts.yml -l -n navigator --serve=3000


(from https://github.com/anaynayak/aws-security-viz)

The configuration file opts.yml allows you to group certain subnets together, or to give more meaningful names to network objects.

--- 
:format: dot
:egress: true
:groups:
  '1.2.3.4/32': 'Demo Host'
  '1.5.4.3/24': 'Remote Subnet'

Conclusion

These scripts aren’t perfect (do a PR to improve them) but they give me the information that I need in an easy to use format. The Markdown tables together with the visualisations make for a good analysing / reporting approach. Obviously you can link the entire chain together and automate the process. Note that there are commercial tools available that provide similar results, but this approach is sufficient (and free) for my needs.

Cyberweapons Arms Race

I recently finished the book “This Is How They Tell Me the World Ends: The Cyberweapons Arms Race” by Nicole Perlroth. The book covers the story of the cyberweapons market and how government agencies fuelled this economy, eventually making the Internet a less safer place for us all.

I added some notes of items of interest in a mindmap that are maybe of use for others. The map is not complete at all, feel free to update it further. Github: https://github.com/cudeso/tools/blob/master/Cyberweapons%20Arms%20Race.xmind and a high-ress PNG at https://github.com/cudeso/tools/blob/master/Cyberweapons%20Arms%20Race.png.