Iranian threat groups

In light of recent developments it would be a good idea to sketch a picture of the known Iranian threat groups. I used the information made available by MITRE ATT&CK.

Threat groups

Group5 is a threat group with a suspected Iranian nexus, though this attribution is not definite. The group has targeted individuals connected to the Syrian opposition via spearphishing and watering holes, normally using Syrian and Iranian themes. Group5 has used two commonly available remote access tools (RATs), njRAT and NanoCore, as well as an Android RAT, DroidJack.

OilRig or APT34 is a suspected Iranian threat group that has targeted Middle Eastern and international victims since at least 2014. The group has targeted a variety of industries, including financial, government, energy, chemical, and telecommunications, and has largely focused its operations within the Middle East. It appears the group carries out supply chain attacks, leveraging the trust relationship between organizations to attack their primary targets.

Charming Kitten is an Iranian cyber espionage group that has been active since approximately 2014. They appear to focus on targeting individuals of interest to Iran who work in academic research, human rights, and media, with most victims having been located in Iran, the US, Israel, and the UK. Charming Kitten usually tries to access private email and Facebook accounts, and sometimes establishes a foothold on victim computers as a secondary objective. The group’s TTPs overlap extensively with another group, Magic Hound, resulting in reporting that may not distinguish between the two groups’ activities.

APT33 is a suspected Iranian threat group that has carried out operations since at least 2013. The group has targeted organizations across multiple industries in the United States, Saudi Arabia, and South Korea, with a particular interest in the aviation and energy sectors.

Resources

Use Sysmon DNS data for incident response

Sysmon DNS

Recent versions of Sysmon support the logging of DNS queries. This is done via event ID 22 in Applications and Services Log > Microsoft > Windows > Sysmon Operational.

To enable DNS logging, you need to include the section DnsQuery in your Sysmon configuration file. For example via

<Sysmon schemaversion="4.21">
 <EventFiltering>
  <DnsQuery onmatch="exclude" />
 </EventFiltering>
</Sysmon>

Note that enabling DNS queries can be noisy. It’s best to apply filtering as proposed by the SwiftOnSecurity sysmon config file and, additionally, filter out the commonly used -internal- hostnames of your environment.

Now, once enabled, what can you do with this data? It’s a great resource for incident response but you can also use it to build a Passive DNS database. If you don’t know Passive DNS, read Passive DNS for Incident Response or
Use Passive DNS to Inform Your Incident Response
.

Collect Sysmon DNS logs (in SQLite)

My preferred setup for Passive DNS is Bro (Zeek) monitoring the network traffic, storing DNS queries in a SQLite database and then using MISP data to check IP and domain records. To have a similar setup for Sysmon I needed to extend the SQLite database schema with the fields hostname (Windows host doing the queries), status (query status field in the event log) and image (Windows application doing the DNS query). My processing chain then consisted of

  1. Windows clients logging DNS queries via Sysmon;
  2. Events are sent to a central logger via Log Forwarding (you can also use Winlogbeat);
  3. The event logs are daily parsed via a Powershell script started from scheduled job;
  4. The results are stored in a -shared- SQLite database. This database is also used by Bro (INSERT only);
  5. I then have a daily job to verify if the list of queried domains were seen in MISP.

The system that does the parsing must have the SQLite driver for Windows installed. You also need to place Get-WinEventData.ps1 in the same directory as from where you launch the script.

Powershell script: passivedns.ps1

Disclaimer: the current script isn’t complete, it tracks the DNS queries but the correct firstseen, lastseen and count isn’t implemented yet. For now, firstseen is set to the time of the creation of the Windows event.

Building blocks

The script can be found on Github passivedns.ps1. It consists of a couple of blocks

  • createDataBase : this function creates the database, if it doesn’t exist yet. For my setup this was on a shared location where Bro could also write to;
  • queryDatabase : a test function to query the content of the SQLite database. You can also use a graphical browser as DB Browser for SQLite;
  • insertDatabase : function to add a row to the database;
  • Log-It : helper function for logging;
  • fetchEvents : the main function, this fetches the events, does some conversion and writes it to SQLite.

Configuration

The configuration is inline. You need to change these parameters

  • Add-Type -Path : the path to the SQLite dll (System.Data.SQLite.dll);
  • $LogPath : (in Log-It), the path for the log file;
  • $Today : (in fetchEvents), the timestamp to use to query the events. I have a daily job, so I need to fetch the events -1 day.
  • $DBPath : the path to the SQLite database.

    Running the script

    You can run the script from Powershell

    PS C:\Users\Administrator> C:\Users\Administrator\passivedns.ps1
    DB Exists: Ok
    
    0
    1
    ...
    

  • Improve Your Detection Capabilities With Cyber Simulation Datasets

    I published an article on the IBM SecurityIntelligence blog on how to Improve Your Detection Capabilities With Cyber Simulation Datasets

    The post describes how you can develop a strategy for testing and improving your existing detection capabilities. It starts with the traditional testing strategies as paper tests and tabletop exercises. The bulk of the article covers cyber simulation datasets, including network based data sets, host based datasets and system and application logs. The final part of the article is on the more advanced datasets, including automated adversary emulation.

    BelgoMISP Meeting 0x01 : Belgian MISP User Group Meeting

    Interested in sharing your MISP usage experiences? How did you integrate MISP in your incident response workflow? Have anything to say about threat sharing in general?

    There’s a BelgoMISP Meeting 0x01 for all Belgian MISP users. Submit your proposals via Github or contact us via Twitter.

    Measure and Improve the Maturity of Your Incident Response Team

    I published an article on the IBM SecurityIntelligence blog on how to Measure and Improve the Maturity of Your Incident Response Team

    The post describes how you can create an incident response development plan and which proven frameworks exist to assist you with this. I then provide more details on the NIST and the Global CSIRT Maturity framework. The latter, which is based on SIM3 and the ENISA three-tier approach, is then covered in more detail.

    How PR Teams Can Prepare for Data Breach Risks With Incident Response Planning

    I published an article on the IBM SecurityIntelligence blog on How PR Teams Can Prepare for Data Breach Risks With Incident Response Planning

    The post describes how you can take control of the incident response communication, how to prepare for incidents by identifying your stakeholders and preparing communication templates and which tooling is available for communication during a security incident.

    Use PyMISP to track false positives and disable to_ids in MISP

    Sightings, false positives and IDS

    Attributes in MISP have a boolean flag to_ids allowing you to indicate if an attribute should be used for detection or correlation actions. According to the MISP core format data standard, the to_ids flag represents whether the attribute is meant to be actionable. Actionable defined attributes that can be used in automated processes as a pattern for detection in Local or Network Intrusion Detection System, log analysis tools or even filtering mechanisms.

    Unfortunately attributes marked with this to_ids flag can sometimes also lead to false positives. Recent work on the decaying of Indicators allows you to guarantee the quality of the indicators but requires some more setup. In the mean time you can use the sightings system to indicate the quality of an indicator and report an indicator as a false or true positive.

    PyMISP to track false positives

    I wrote a Python script that uses PyMISP to disable the to_ids flag for attributes with a number of false positive reported sightings. The scrip is included in the examples section of PyMISP and has this logic flow

    • Based on an incident investigation, an analyst reports the false positive (or true positive) via the sighting mechanism in MISP (via the interface or via the API);
    • The script runs regularly from cron, fetching all the attributes with the to_ids flag set;
    • Whenever an attribute is found with more than minimal_fp reported false positives, which are all more recent than minimal_date_sighting_date then it evaluates the balance false positive to true positive;
    • When the balance false_positive / (true_positive + false_positive) is above or equal to the threshold_to_ids value it will then set the to_ids flag to false;
    • As a last step, the event is republished without email notification;
    • Depending on the provided options, the script will then send a report of attributes which were changed.

    Configuration

    The configuration of the script is inline or can be done via command line options.

    • minimal_fp or -b : the minimal number of false positive (default 0);
    • threshold_to_ids or -t : the threshold above which the to_ids flag is disabled (default .50);
    • minimal_date_sighting_date or -d : Minimal date for sighting (false positive / true positive) (default 1970-01-01 00:00:00);

    You can instruct the script to send mail by adding -m or –mail. The mail settings can be supplied via -o or –mailoptions or via inline configuration (smtp_from, smtp_to and smtp_server).

    Ideally you run the script from cron every night. You can do this by adding a cronjob

        */5 *    * * *   mispuser   /usr/bin/python3 /home/mispuser/PyMISP/examples/falsepositive_disabletoids.py -m -o 'smtp_from=admin@domain.com;smtp_to=admin@domain.com' -b 5
    

    Docker image for PyMISP (and create MISP data statistical reports)

    PyMISP

    Installing PyMISP can sometimes be difficult because of a mixup between Python2 and Python3 libraries or problems with pip install. To solve this I created a PyMISP docker container that allows you to run the scripts in the example directory, without the need of installing PyMISP itself.

    The Dockerfile is in the Github repository PyMISP-docker. The docker container is available via Docker Hub cudeso/pymisp.

    MISP data statistical reports

    In a previous post I covered how to create MISP data statistical reports. That version required some inline configuration if you wanted the reports to be send to you automatically.

    I altered the script slightly so you can now also provide the mail configuration as an argument to the script. The -o option allows you to provide the smtp_from, smtp_to and smtp_server variables (these where previously configured inline).

    -o 'smtp_from=you@example.com;smtp_to=manager@example.be;smtp_server=smtp.example.com'
    

    Docker container

    Container info

    The container is build on a Python image, fetches the latest repo of PyMISP and installs the PyMISP module.

    Tags

    Two tags are available:

    • cudeso : an image build on my repository, this is when there’s a PR pending and I already want the container to be ready;
    • misp : an image build on the MISP PyMISP repository.

    Run the container

    PyMISP requires a key.py file for authentication credentials. You need to make this file available to the container via the mount option. As an example, to run the data statistical reports you can run the container with this command

    docker run --rm --mount type=bind,source="$(pwd)"/config/keys.py,target=/PyMISP/examples/keys.py cudeso/pymisp:cudeso python3 /PyMISP/examples/stats_report.py -t 30d -m -o 'smtp_from=you@example.com;smtp_to=manager@example.be;smtp_server=smtp.example.com'
    

    For the above example to work, create a directory /config in the path where you run the docker command and copy the keys.py file in that directory.

    If the container is unable to connect to the MISP instance, try adding –network host to make the host network available.

    docker run --rm --network host --mount type=bind,source="$(pwd)"/config/keys.py,target=/PyMISP/examples/keys.py cudeso/pymisp:cudeso python3 /PyMISP/examples/stats_report.py -t 30d -m -o 'smtp_from=you@example.com;smtp_to=manager@example.be;smtp_server=smtp.example.com'
    

    Generating MISP data statistical reports

    MISP Statistics

    The MISP API includes a couple of features that you can use to report on the type of data stored in the database. For example the User statistics or Attribute statistics give a pretty good overview. Unfortunately, as of now it’s not possible to limit the output of these functions to a specific timeframe. For my use case I’d like to report on the MISP data statistics for the last month. The information that I want to include is

    • How many new or updated events?
    • How many new or updated attributes?
    • How many new or updated attributes with IDS flag?
    • The category of the attributes
    • TLP-coverage

    PyMISP example module

    I wrote a PyMISP script that does all of the above and more. The script fetches the event and attribute data for a given timeframe and then reports the statistics. The report is send via e-mail and the data is attached as individual CSV files.

    The script can be found in the PyMISP repository stats_report.py. The configuration of the script is inline in the Main module. If you want to receive the reports by e-mail you will have to change

    smtp_from
    smtp_to
    smtp_server
    

    The script should be run from cron and accepts these parameters

    • -t : the timeframe, typically you’ll use ‘-t 30d’
    • -e : include the MISP events titles in the output;
    • -m : mail the report or only have the output to screen;

    A typical use from cron would then be

    */5 *    * * *   mispuser   /usr/bin/python3 /home/mispuser/PyMISP/examples/stats_report.py -t 30d -m -e
    

    Refactor the output

    Part (or in fact the quality) of the statistics rely on how the contributors have added the data. For instances that receive events from different sources this can result in a lack of consistency, or even quality of data. This script includes some basic logic to work with this but you might have to tune this to your environment.

    Event and attribute statistics

    The first part of the statistics should normally be usable by all environments. Note that if you use your reporting to people outside your organisation you should indicate that the data concerns new or updated events.

    MISP Report 2019-07-12 23:53:12 for last 30d on https://XXXXX/
    -------------------------------------------------------------------------------
    New or updated events: 658
    New or updated attributes: 24834
    New or updated attributes with IDS flag: 14484
    
    Total events: 60293
    Total attributes: 7382714
    Total users: 2519
    Total orgs: 1208
    Total correlation: 8521911
    Total proposals: 77595
    

    Items to include in your report based on the output of this script are

    • Evolution of number of events and attributes over time
    • Evolution of number attributes with IDS flag over time

    Attribute category

    The next part that’s interesting to report is the number of attributes per category. According to the MISP core format RFC, the category represents the intent of what the attribute is describing as selected by the attribute creator.

    Network activity 	 9530
    Payload delivery 	 4963
    Antivirus detection 	 3914
    Financial fraud 	 3114
    External analysis 	 1828
    Artifacts dropped 	 694
    ...
    

    If you report this information, then it’s useful to include an explanatory table for the different categories.

        Antivirus detection: All the info about how the malware is detected by the antivirus products
        Artifacts dropped: Any artifact (files, registry keys etc.) dropped by the malware or other modifications to the system
        Attribution: Identification of the group, organisation, or country behind the attack
        External analysis: Any other result from additional analysis of the malware like tools output
        Financial fraud: Financial Fraud indicators
        Internal reference: Reference used by the publishing party (e.g. ticket number)
        Network activity: Information about network traffic generated by the malware
        Other: Attributes that are not part of any other category or are meant to be used as a component in MISP objects in the future
        Payload delivery: Information about how the malware is delivered
        Payload installation: Info on where the malware gets installed in the system
        Payload type: Information about the final payload(s)
        Persistence mechanism: Mechanisms used by the malware to start at boot
        Person: A human being - natural person
        Social network: Social networks and platforms
        Support Tool: Tools supporting analysis or detection of the event
        Targeting data: Internal Attack Targeting and Compromise Information
    

    Reporting the attribute types might only be useful if you report to a more technical audience.

    TLP-codes

    Reporting the TLP codes of the received events is useful to indicate if information was available for everyone or only for
    restricted receivers. Note that the script tries to sanitise the different notations of the TLP codes by transforming everything to lower case and removing spaces. For example the notation of “TLP:White”, “TLP: White” and “tlp : white” should all result in “tlp:white”.

    tlp:white 	 338
    tlp:green 	 286
    tlp:amber 	 7
    tlp:red 	 0
    

    MISP Galaxy

    The use of the MISP Galaxy really depends on your sector. The next sections of the report dive deep into some categories of the MISP Galaxies but items you can report are for example

    • misp-galaxy:banker : Banker malware
    • misp-galaxy:financial-fraud : Financial fraud
    • misp-galaxy:tool : Threat actors tooling

    MISP Galaxy MITRE

    Events which are added to the clusters starting ‘misp-galaxy:mitre’ are reported individually. This is good data to report how your threat intel feed covers the Mitre ATT&CK framework. As mentioned before, the quality of this data depends on the contributors.

    misp-galaxy:mitre-enterprise-attack-intrusion-set="APT28 - G0007" 	 12
    misp-galaxy:mitre-enterprise-attack-intrusion-set="Lazarus Group - G0032" 	 5
    misp-galaxy:mitre-intrusion-set="APT28" 	 4
    misp-galaxy:mitre-enterprise-attack-intrusion-set="MuddyWater - G0069" 	 3
    misp-galaxy:mitre-enterprise-attack-attack-pattern="Spearphishing Attachment - T1193" 	 3
    misp-galaxy:mitre-attack-pattern="Standard Application Layer Protocol - T1071" 	 3
    misp-galaxy:mitre-attack-pattern="Spearphishing Attachment - T1193" 	 3
    misp-galaxy:mitre-pre-attack-intrusion-set="APT28" 	 2
    misp-galaxy:mitre-malware="AutoIt" 	 2
    misp-galaxy:mitre-enterprise-attack-attack-patt
    

    MISP Galaxy Threat Actor

    Similar to the Mitre ATT&CK framework, the script will also report on the threat actors, if they have been added by the event contributors. This is also a great resource to report.

     
    misp-galaxy:threat-actor="Sofacy" 	 24
    misp-galaxy:threat-actor="Lazarus Group" 	 9
    misp-galaxy:threat-actor="OilRig" 	 5
    misp-galaxy:threat-actor="MuddyWater" 	 5
    misp-galaxy:threat-actor="INDRIK SPIDER" 	 5
    misp-galaxy:threat-actor="APT37" 	 5
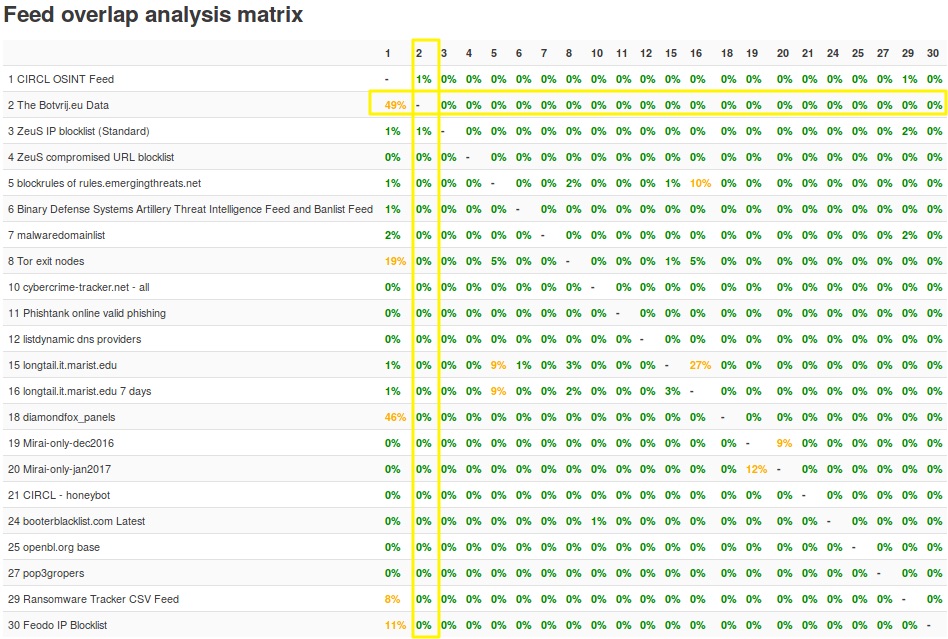
    

    Reporting failures

    Do not get trapped into the “my instance has more indicators than yours”, eventually it’s the quality of the indicators that counts. Having recent and vouched (sightings isn’t included yet in the reporting) indicators is important. As a start, the MISP documentation provides you with a Feed overlap matrix.


    GDPR and Apache logs, remove last octet of an IP address

    GDPR and IP addresses

    For a new project I had to identify the source network of visitors of an http site, served via Apache. I did not need their individual IP address. This is something you’ll encounter when dealing with logs in light of the GDPR and having to store only the minimum amount of personal data necessary.

    In essence it meant I needed a way to store the log requests and remove the last octet of the IP address. This will not work properly for networks smaller than /24 but this wasn’t an issue for this project.

    The first approach was to do this when processing the logs with Logstash. But this still meant the real IP address was somewhere stored in the web logs. There must be a better way.

    Apache – Log-ipmask

    Enter the Apache web module apache2-mod-log-ipmask.

    The mod_log_ipmask module is designed to work with version 2.4 of the Apache HTTP Server. It extends the mod_log_config module by overriding the %a and %h format strings in order to limit the number of IP address bits that are included in log files. This is intended for applications where partial logging of IP addresses is desired, but full IP addresses may not be logged due to privacy concerns.

    This sounds exactly what I needed. Unfortunately there’s no Ubuntu 18.04 package available so I had to build it from source.

    Ubuntu

    For this to work you need git to download the repository, the packages needed to build your own Debian packages and the Apache headers.

    apt-get install git
    apt-get install devscripts debsign
    apt-get install fakeroot build-essential
    apt-get install dh-apache2
    

    Fetch the source code and start building.

    git clone https://github.com/aquenos/apache2-mod-log-ipmask.git
    cd apache2-mod-log-ipmask
    dpkg-buildpackage -uc -us
    

    This will then give you the Debian package that you can install with

    dpkg -i ../libapache2-mod-log-ipmask_1.0.0_amd64.deb
    

    As a last step you need to enable the module (although normally it will already be enabled after installation).

    a2enmod log_ipmask
    

    Configuration

    The configuration of the package is straightforward. You only need to change two lines in /etc/apache2/mods-enabled/log_ipmask.conf

    <IfModule log_ipmask_module>
            # Restrict logging of IPv4 addresses to the first 24 bits.
            LogDefaultIPv4Mask 24
            # Restrict logging of IPv6 addresses to the first 56 bits.
            LogDefaultIPv6Mask 56
    </IfModule>
    

    Because I only needed the last octet removed, I had to keep the first three octets, resulting in 24 bits. The module also has support for IPv6.

    Logs

    After enabling the module and restarting Apache you’ll see that the network addresses now no longer contain the last, identifying part. This has been replaced with a 0.