Log analytics
Centralized logging is essential during incident response. If you can only rely on local logs then you risk losing crucial information when reconstructing the timeline of a security incident. Local logs should not be trusted during an incident as they might have been altered by an intruder. Additionally centralized logging allows you to combine different log sources into one data set for investigation.
I used a couple of centralized log solutions in the past, including Splunk and ELK (Using ELK as a dashboard for honeypots) for monitoring honeypots.
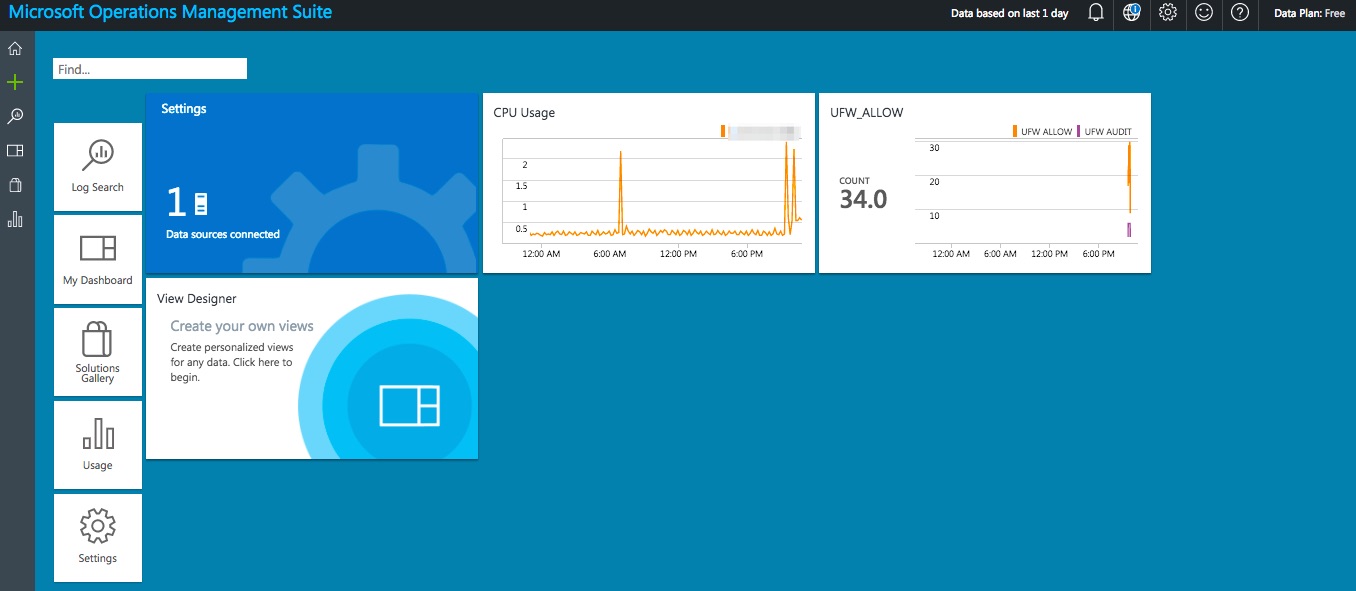
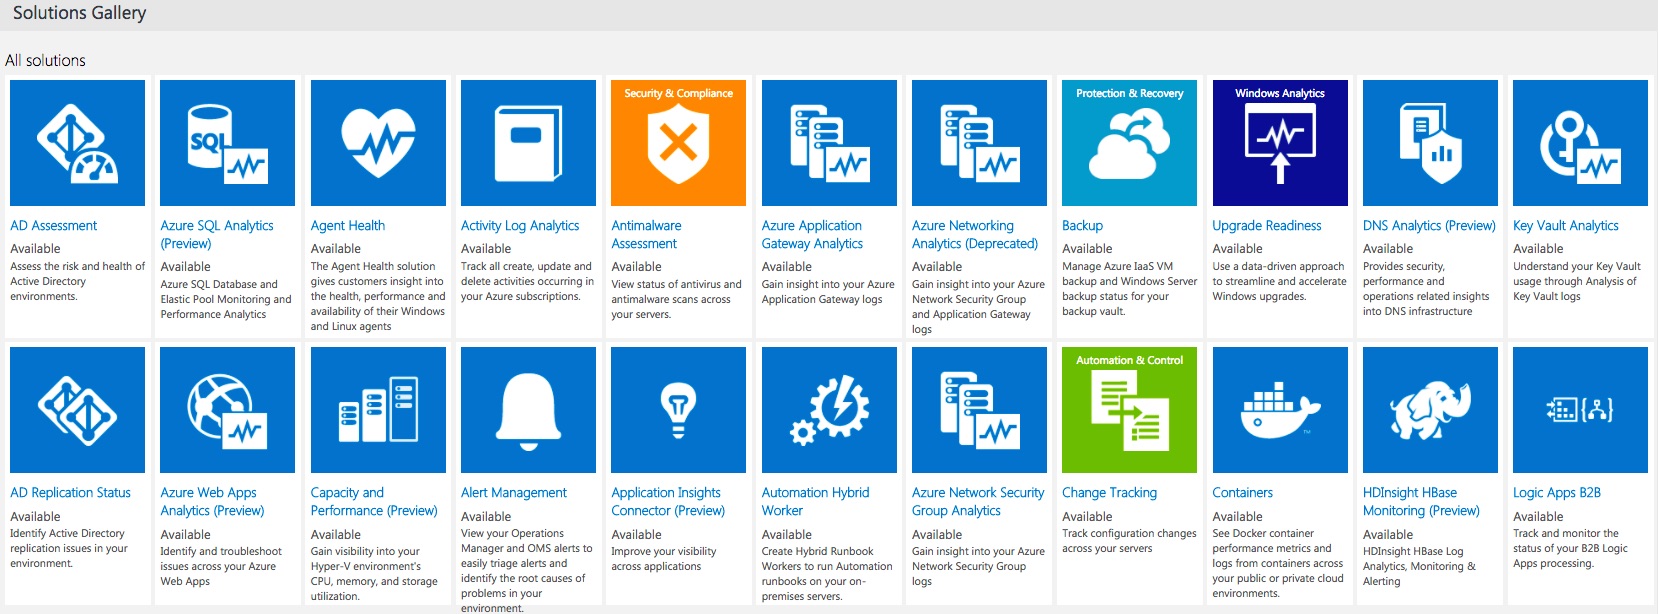
Microsoft recently also jumped on the bandwagon of “centralized logging” with their Azure provided Log Analytics, part of the Operations Management Suite (OMS). And it comes with a free plan, allowing you to store data for up to 7 days. In most cases 7 days will not be enough for incident response but it’s more than enough to build a data set and evaluate the product.
Adding a Linux host to OMS
Once you signed up for OMS the first thing to do is adding a host. My honeypots run on Linux. Adding a Linux host is a matter of a few clicks in the Connected Sources tab in OMS.
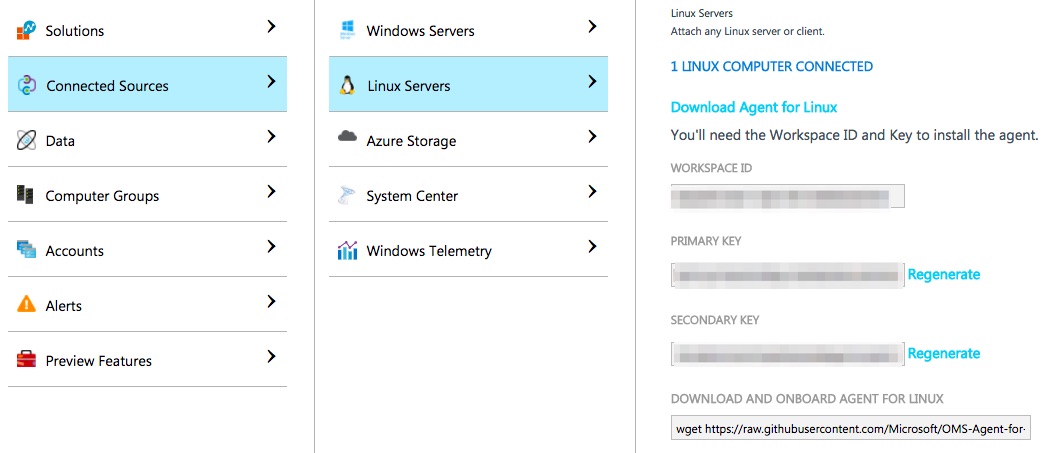
Installing the Linux agent is described in detail at Connect your Linux computers to Log Analytics. It requires you to download the package and then install it.
Once you have installed the Linux agent you will need to wait a while before the agent data turns up in OMS.
Microsoft Log Analytics Search
The log search feature is quite powerful and intuitive but in essence no different than the search feature in Splunk or Kibana.
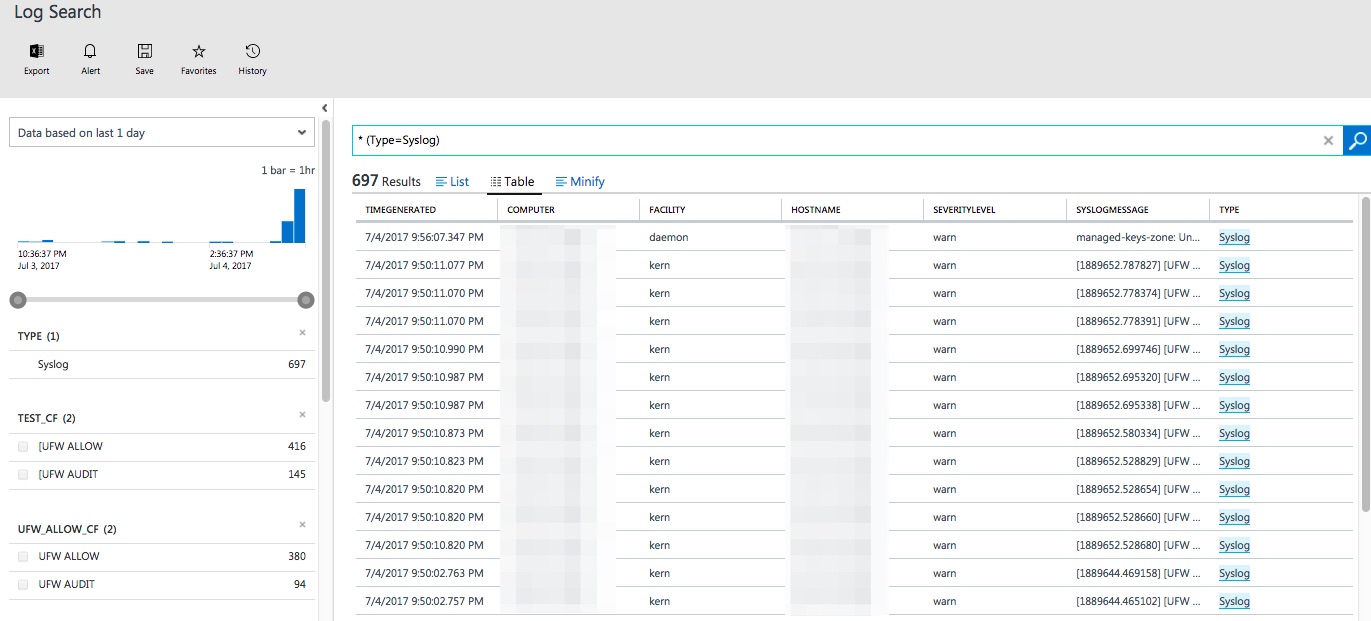
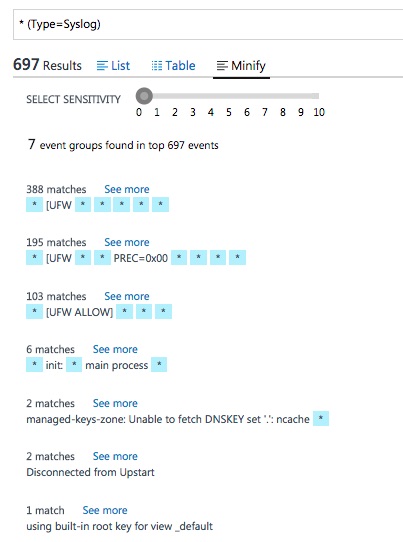
The search either gives you a list or a table view. You can select or deselect the filters by the menu on the left. The list of filters (source type, fields, …) gets updated when you drill down the data set. Additionally the Minify option gives you a summarised view of the result set.
I found this Minify option very useful to have quick overview of what type of data was most present in the result set. If you have lots of records and it’s difficult to find what’s common between the different records then this option is certainly a time saver.
You can also immediately apply conversation filters on these results and get a graph of the data
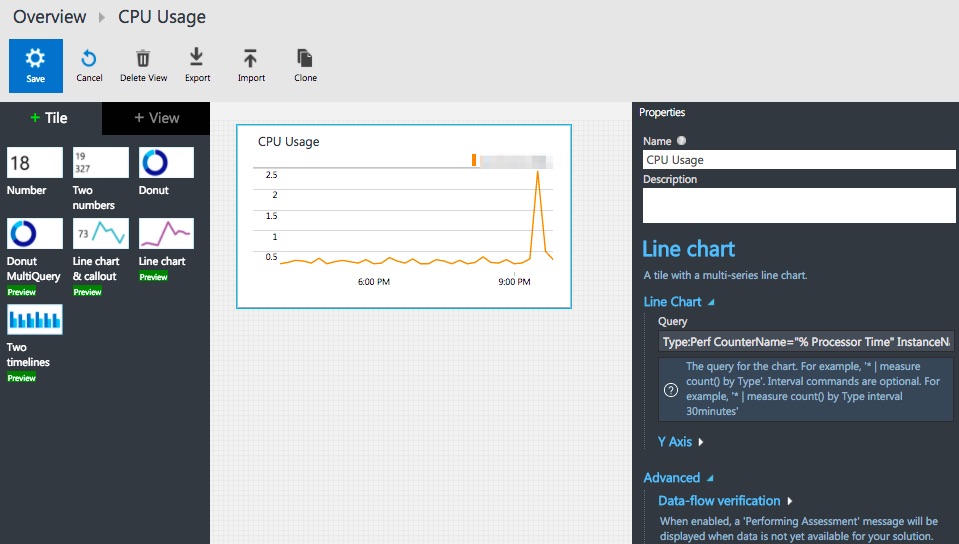
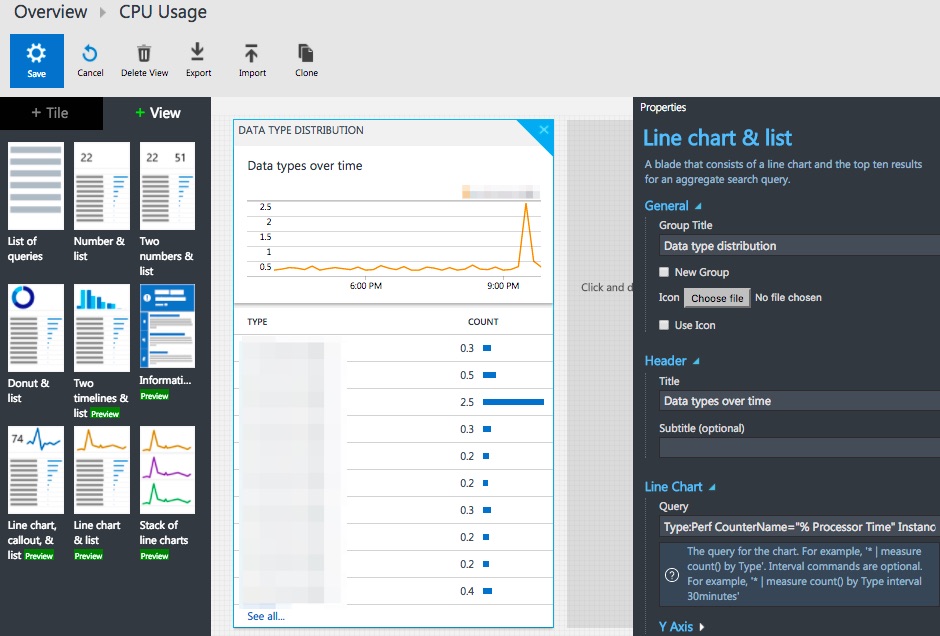
Graphs
We all want graphs because vizualisations of events is the easiest way for detecting anomalies in a large data set.
Creating graphs in OMS is a matter of point and click. And frustration. The slight syntax differences between search and graph queries are annoying and make it difficult to get quick results. Additionally OMS makes a difference between a Tile (a block that you can put on the start screen) and a View. The latter are the type of graphs you want on a dashboard. Unfortunately there’s no “create view from tile”. Adjusting the filter expression does not always immediately update the graph, this required reloading the entire page on some occassions.
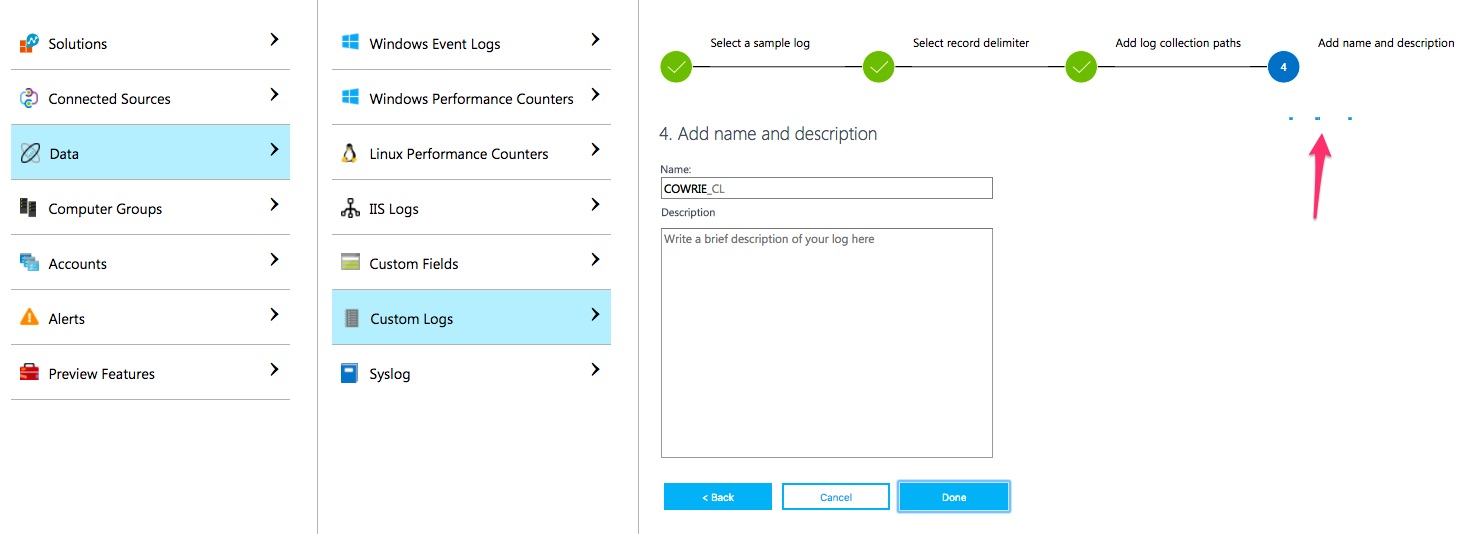
Custom logs
You can add your own custom log files to OMS. A great feature is that you do not have to log in to the machine that’s running the agent and manually alter configuration files. All the changes can be done via the web interface. You’re done after uploading a log file sample, selecting the record delimiter and the log collection path. The last step can take a while before being completed.
Once completed, this will add a section to the configuration file of the agent.
<source>
  type sudo_tail
  path /home/ubuntu/parse-dionaea/cowrie/cowrie-connections.log
  pos_file /var/opt/microsoft/omsagent/state/CUSTOM_LOG_BLOB.cowrie_connections_CL__REDACTED.pos
  read_from_head true
  run_interval 30
  tag oms.blob.CustomLog.CUSTOM_LOG_BLOB.cowrie_connections_CL_REDACTED.*
  format none
</source>
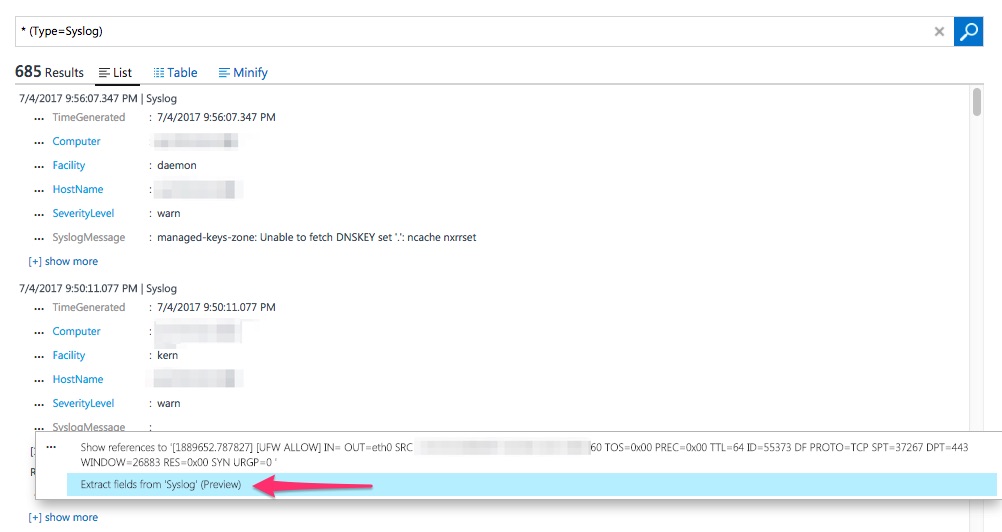
Custom fields
Typically the logs gathered by honeypots aren’t in a format that’s immediately understood by the search engine. Microsoft allows you to define custom fields in log files.
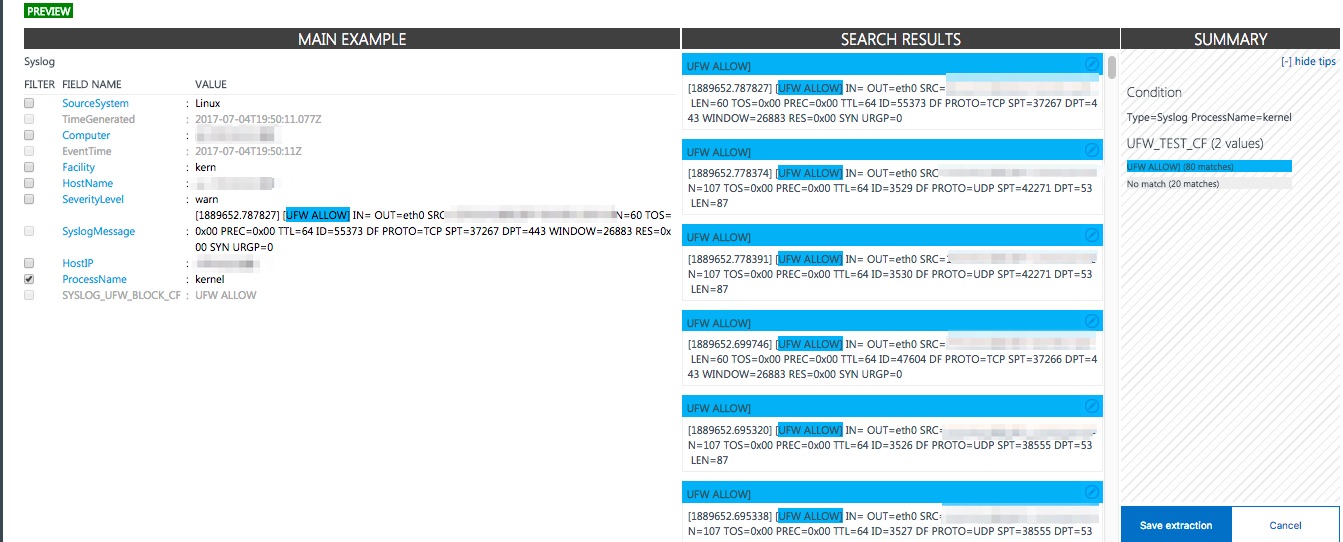
The custom fields are created starting from a search query. You select one of the fields that contain the custom log data and then go to the wizard to extract data.
Once you have selected the field, the wizard will ask you for a name and propose the matches according to your previous selection. A nice thing of the wizard is that you can alter the selection and immediately see the results.
Once that you have defined the custom fields you have to wait for new data to enter. Unfortunately, the custom fields are not applied to the data that is already in the database.
Remarks
Slow or unresponsive web interface
Although the web interface for OMS looks relatively slick it’s a real pain. Sometimes it’s slow or not responding and then you can only revert to reloading the web page (and loosing the changes or queries you just made). Working with multiple tabs and seeing your changes light up in the other tabs doesn’t always work. Most of the time it required a full page reload before you can access your changes. Testing was done with the latest version of Chrome on OSX.
These malfunctions and bugs are acceptable in a “proof-of-concept” but not in a production environment. It almost feels as if Microsoft is using their users as a testbed. I don’t mind when this concerns the ‘dev’ branch of a free version but if I would be a paying customer I would be very dissatisfied with its current (Jul-17) state.
That said, there’s almost not a week that goes by when you discover that a new feature is introduced.
Search is good
If you are interested in a good search engine for analyzing your logs with manual queries then OMS is certainly a good choice. The search feature with autocomplete suggestions is definitely worth looking at.
Storing your logs with a cloud provider
Storing my honeypot logs with a cloud provider isn’t that much of a deal. But storing the logs of your crown jewels with an external provider that is still in the process of “getting things right” is maybe not the best thing to do.
Choose your targets!
I used OMS for collecting honeypot data. Although there are a couple of features that allow it to parse Linux logs it’s not a perfect solution.
I did not had the time to evaluate some of the more integrated Windows features but looking at the options presented they do look promising.
Conclusion
Would I choose the Microsoft Log Analytics solution for monitoring my honeypots? No. This product is still a “work in progress” and it takes quite some time and effort for getting the expected results.
Does it have potential? Yes. The search feature is really good and if they can iron out the flaws in the web interface and make the process of “acquire external data source > filter > graph on dashboard” more fluent it would certainly be a good competitor for Splunk or ELK. But as of this moment it isn’t.