Introduction
The Elastic stack is a great tool to quickly visualise large volumes of log files. In a previous post I described how to load stored Windows EVTX logs in Security Onion, with the help of Winlogbeat. In this new post I describe something similar with the goal to analyse Linux auditd logs with Elastic. Instead of using the Elastic stack of Security Onion I use an Elastic cluster via Docker and instead of storing the Windows EVTX files, I now store traditional Linux log files such as syslog, cron and auditd in Elastic. For the shipment of the logs I’ll be using Filebeat, instead of Winlogbeat.
Setup the Elastic DFIR cluster
The first step is to deploy an Elastic cluster with Docker. I created a Github repository with all the necessary files: elastic-dfir-cluster. Make sure you have Docker and Docker-compose installed, clone the repository and you’re ready to go.
git clone https://github.com/cudeso/elastic-dfir-cluster.git
The key configuration is in the Docker compose file docker-compose.yml. This will start 2 Elasticsearch nodes, one Logstash node and one Kibana node. The data is stored as a local volume. If your machine is sufficiently powerful, you can add extra Elasticsearch nodes in the configuration.
First you have to init the cluster to remove any remaining old volumes and networks. When this is done, start the cluster. Both init and start are handled with bash scripts.
./init-elastic-dfir.sh
Removing kibana        ... done
Removing logstash      ... done
Removing elasticdfir02 ... done
Removing elasticdfir01 ... done
Removing network elastic_elastic
elastic_data01
elastic_data02
WARNING! This will remove all custom networks not used by at least one container.
Are you sure you want to continue? [y/N] y
WARNING! This will remove all local volumes not used by at least one container.
Are you sure you want to continue? [y/N] y
./start-elastic-dfir.sh
There is a screen on:
	215088.elastic_dfir	(10/24/20 16:45:46)	(Detached)
1 Socket in /run/screen/S-dfir.
The containers are started in a screen, to allow you to periodically review the status of the cluster. Just attach to the screen. Alternatively, you can also dump the container logs.
screen -r elastic_dfir
Filebeat
Filebeat is a log shipper, similar to Winlogbeat. Where Winlogbeat is specific for Windows event logs, Filebeat can ship almost any log you can think of. For this post, I use Filebeat via Docker. There are two things to do to get Filebeat working:
- Point it to the correct log files;
- Setup dashboards and visualisations in Kibana.
Configuration
All the required configuration is in filebeat/filebeat.docker.yml and uses Filebeat modules. This makes it easier to directly have the correct field matchings of data in the log file and the storage in Elastic, and doesn’t require you to write your own Logstash log parser (grok!). The configuration enables the modules auditd, system and iptables. The system module supports syslog and authentication files. In summary, this config allows you to process:
- Auditd log files (Red Hat Linux etc.);
- Syslog messages;
- Cron jobs (via system);
- Sudo activity (via system);
- Users or groups added (via system);
- Remote access via SSH (via system);
- Authentication activity (via system);
- Firewall events (via iptables).
filebeat.config.modules:
  enabled: true
  path: /modules.d/*.yml


filebeat.modules:
- module: auditd
  log:
    enabled: true
    var.paths: ["/volume/audit*"]
    exclude_files: ['\.gz$']

- module: system
  syslog:
    enabled: true
    var.paths: ["/volume/syslog*", "/volume/messages*", "/volume/cron*"]
    exclude_files: ['\.gz$']
  auth:
    enabled: true
    var.paths: ["/volume/auth.log*", "/volume/secure*"]
    exclude_files: ['\.gz$']

- module: iptables
  log:
    enabled: false
    var.paths: ["/volume/iptables.log*"]
    var.input: "file"
    exclude_files: ['\.gz$']

output.elasticsearch:
  hosts: ["elasticdfir01:9200"]

setup.kibana:
  host: "kibana:5601"
The only important thing to remember is that the log files you want to process need to be stored in the directory ‘logs’. This directory needs to exist in the folder where docker-compose was executed. In most circumstances this will be the folder that you used to clone the repository (elastic-dfir-cluster).
mkdir elastic-dfir-cluster/logs
Once you have the log files in the correct location, start the container with
docker run -d --net=elastic_elastic --name=filebeat --volume="$(pwd)/filebeat/filebeat.docker.yml:/usr/share/filebeat/filebeat.yml:ro" --volume="/home/dfir/elastic/logs/:/volume/:ro" -e -strict.perms=false docker.elastic.co/beats/filebeat:7.9.2 filebeat
Create the dashboards and visualisations
While the Elastic stack is processing the log files, you can continue with the second step: create the dashboards and visualisations. You don’t have to create them from scratch, Filebeat can do the bulk of the work for you.
docker exec -it filebeat sh -c "/usr/share/filebeat/filebeat setup -e"
Filebeat will greet you with a message when all is done.
2020-10-24T17:34:45.197Z	INFO	eslegclient/connection.go:99	elasticsearch url: http://elasticdfir01:9200
2020-10-24T17:34:45.199Z	INFO	[esclientleg]	eslegclient/connection.go:314	Attempting to connect to Elasticsearch version 7.9.2
2020-10-24T17:34:45.199Z	INFO	cfgfile/reload.go:262	Loading of config files completed.
2020-10-24T17:34:45.871Z	INFO	fileset/pipelines.go:139	Elasticsearch pipeline with ID 'filebeat-7.9.2-system-auth-pipeline' loaded
2020-10-24T17:34:46.014Z	INFO	fileset/pipelines.go:139	Elasticsearch pipeline with ID 'filebeat-7.9.2-system-syslog-pipeline' loaded
2020-10-24T17:34:46.428Z	INFO	fileset/pipelines.go:139	Elasticsearch pipeline with ID 'filebeat-7.9.2-auditd-log-pipeline' loaded
Note that in some circumstances, Filebeat will not immediately ingest the logs. If this is the case, you can restart the processing of the log files by restarting the container.
docker stop filebeat ; docker rm filebeat
docker run -d --net=elastic_elastic --name=filebeat --volume="$(pwd)/filebeat/filebeat.docker.yml:/usr/share/filebeat/filebeat.yml:ro" --volume="/home/dfir/elastic/logs/:/volume/:ro" -e -strict.perms=false docker.elastic.co/beats/filebeat:7.9.2 filebeat
Elastic dashboards and visualisations
If all worked out fine, you’ll now have a couple of dashboards available in Kibana.
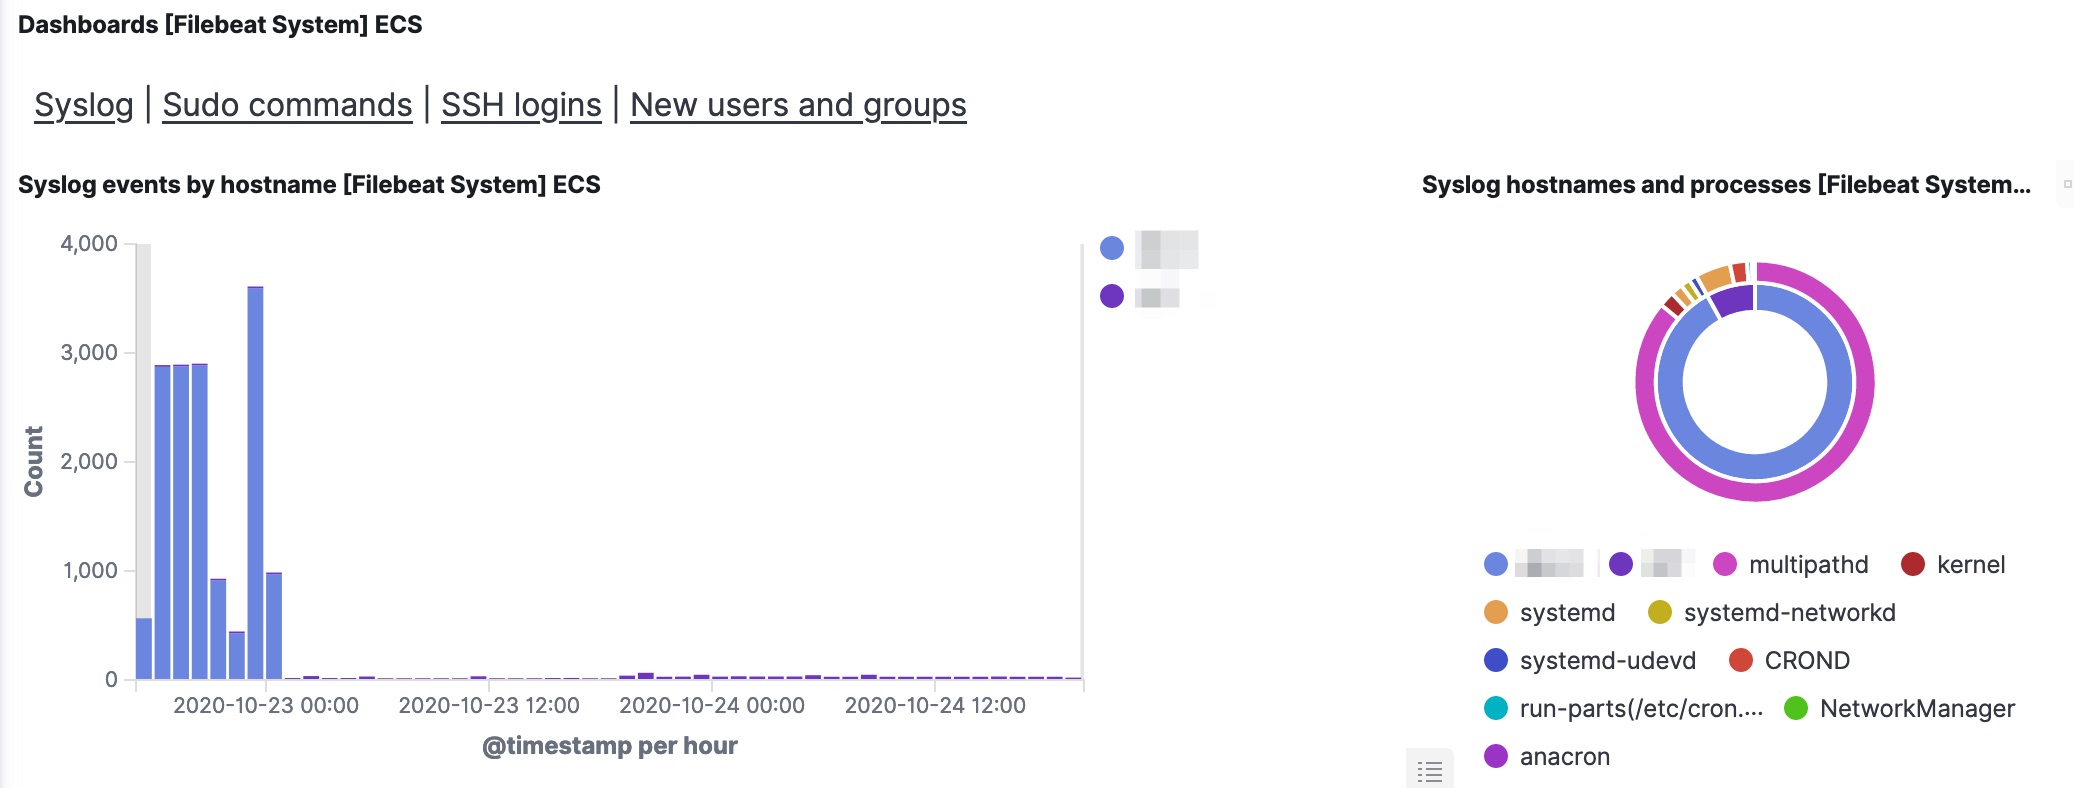
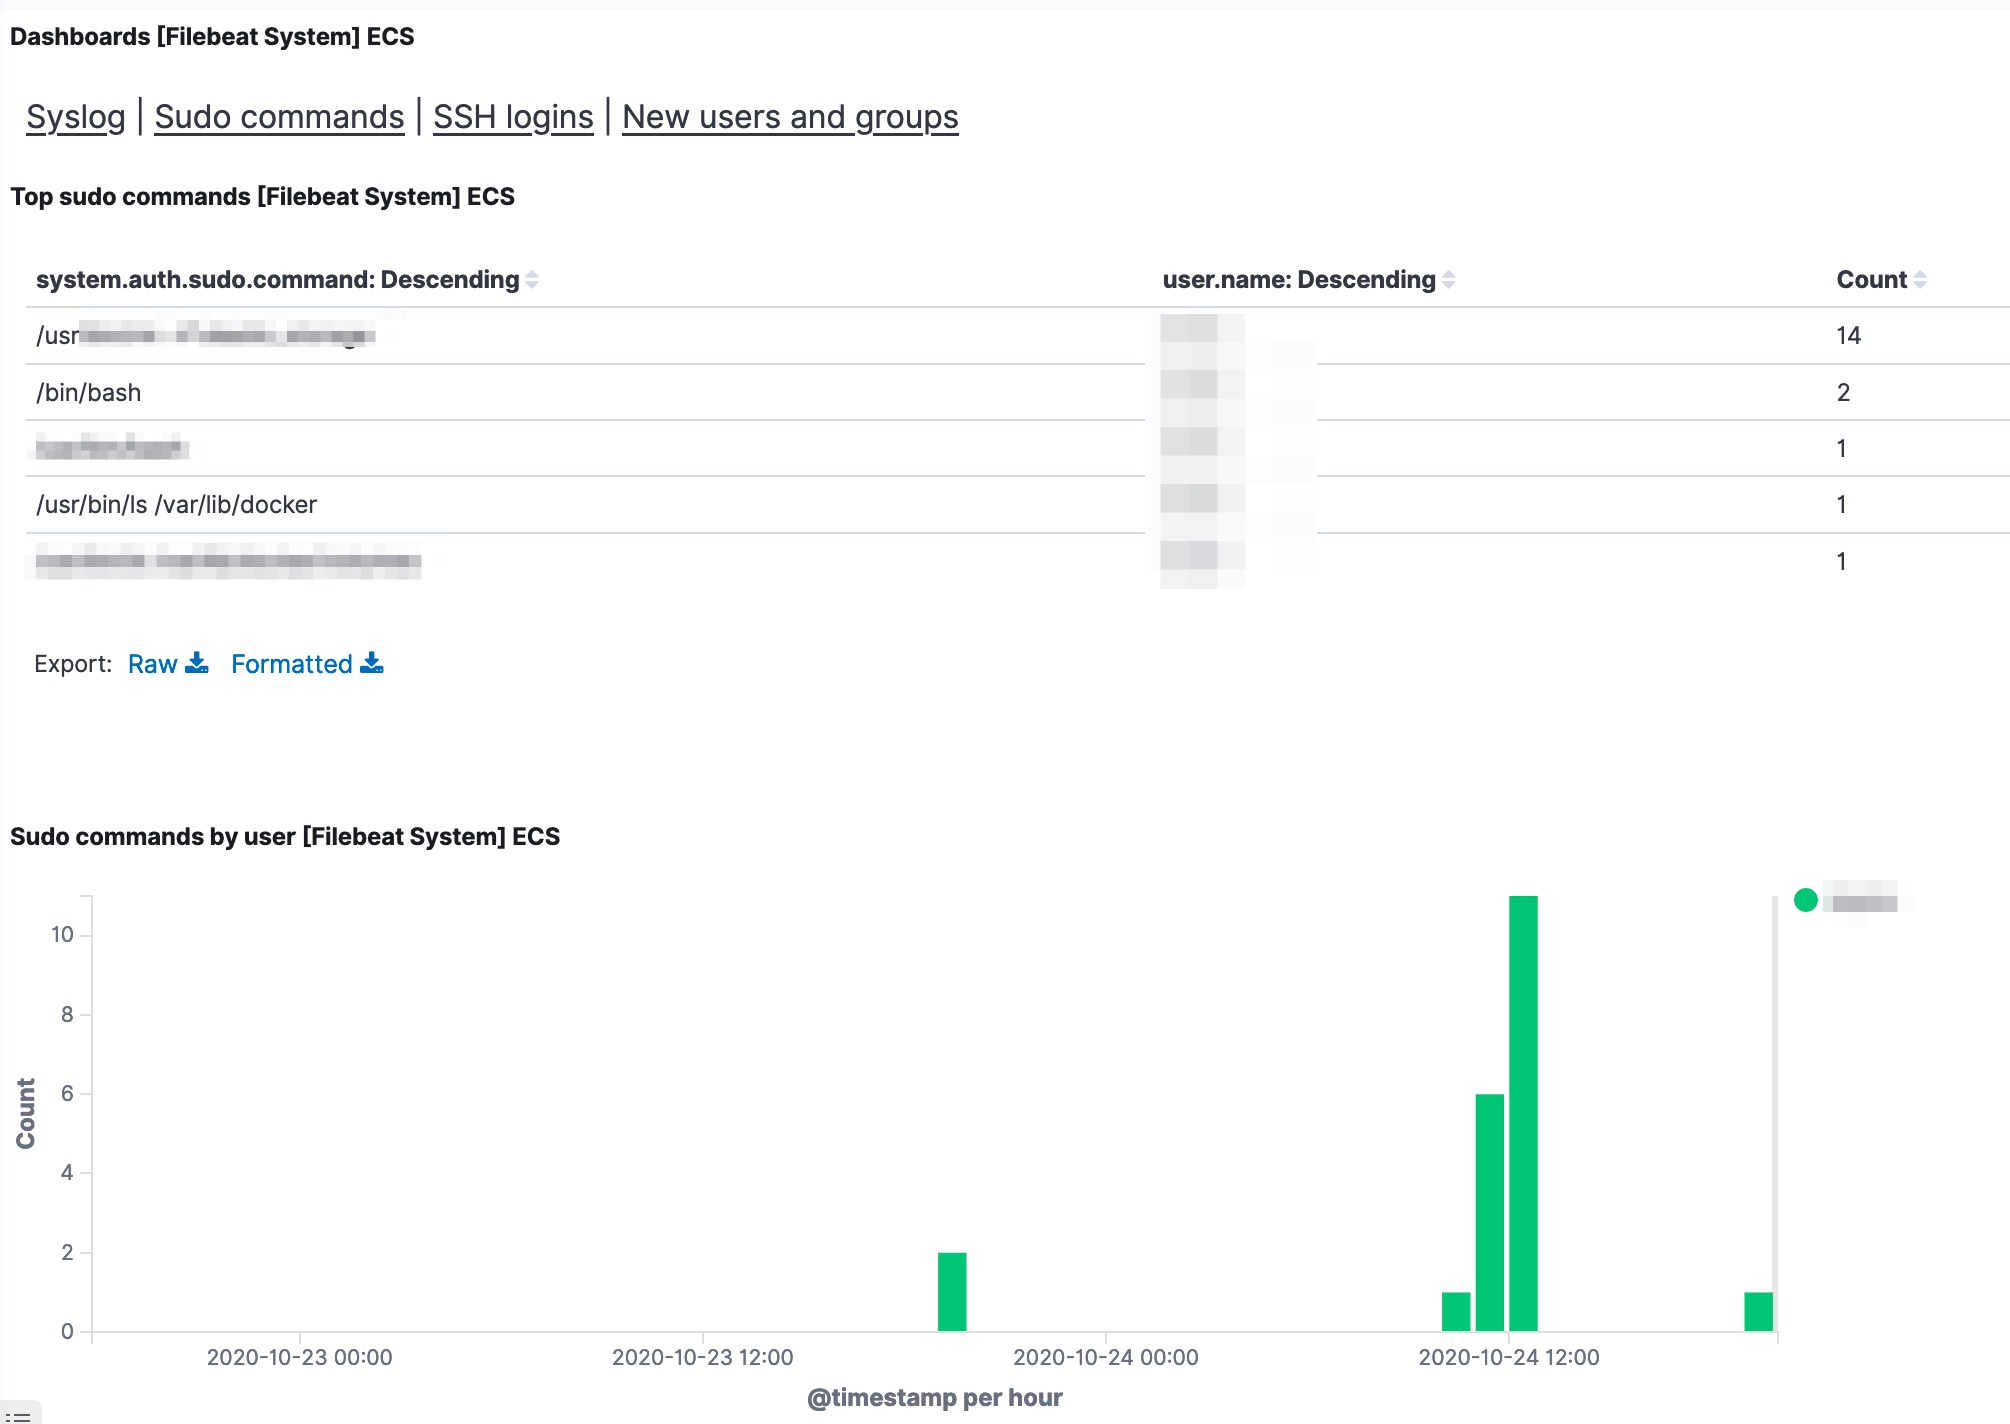
Analyse auditd logs with elastic
Auditd
Apart from the traditional Linux log files, my objective was to analyse auditd logs with elastic. The module is already enabled in Filebeat, there are just a few additional steps to take.
Log process execution with auditd
Auditd provides a very good visibility for Linux system activity, but in order to track the launch of every process you need to tweak the auditd config a bit. As described by secopsmonkey, add a file /etc/audit/rules.d/10-procmon.rules with these lines
-a exit,always -F arch=b64 -S execve -k procmon
-a exit,always -F arch=b32 -S execve -k procmon
Then restart the auditd service. If you can’t restart the auditd service, then check that the systemd script allows manual restarts. In /etc/systemd/system/multi-user.target.wants/auditd.service, RefuseManualStop should be commented.
...
#RefuseManualStop=yes
...

systemctl restart auditd.service
Kibana dashboard
Now there’s one final change you need to do. The Filebeat auditd module transforms the event.action (in fact, the action logged by auditd) to lowercase. In /usr/share/filebeat/module/auditd/log/ingest/pipeline.yml you’ll notice
- lowercase:
    ignore_failure: true
    field: event.action
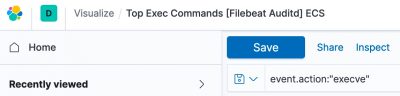
Unfortunately the dashboard for auditd doesn’t take this transform to lower case into account. But there’s a fix. Open the visualisation Top Exec Commands [Filebeat Auditd] ECS. In the top bar you’ll see a filter for EXECVE. Change this to “execve”. Then click Save (and make sure that the checkbox next to ‘Save as new visualization’ is not enabled).
Note that if this change doesn’t work the first time, then first refresh the Kibana field list (Stack Management, Index Patterns) and try again.
Now head to the auditd dashboard. If all went well, all visualisations should contain data.
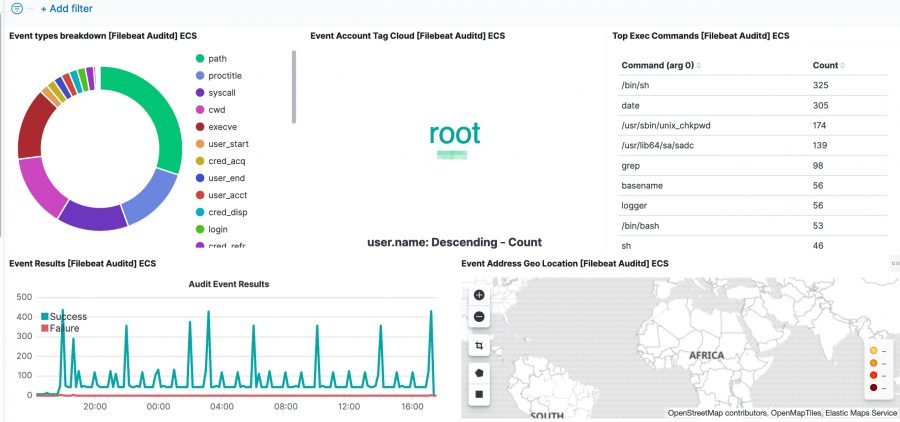
Process tracking
The Kibana dashboard(s) gives you an initial overview what’s happening on your system. But there’s more. The tracking of process execution will not log the user who just executed the process (execve), this information is stored in another log line (the syscall entry). To get this information you have to use the raw data, via Discover.
For example, in the initial dashboard there is a notice that wget is used.
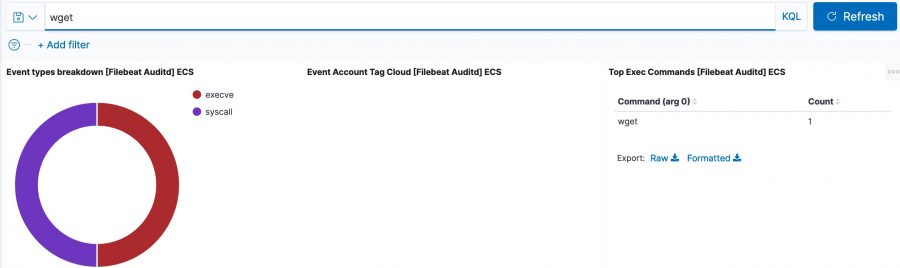
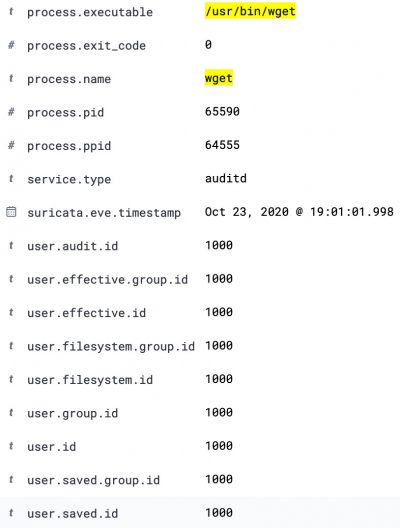
Then in Kibana discovery, filter for the auditd module (via event.module) and then for wget. There will be two events, one is the execve (event.action), preceded by a syscall (event.action) event.
This entry contains the PID, parent PID, and the user ID.
Visualise process tracking
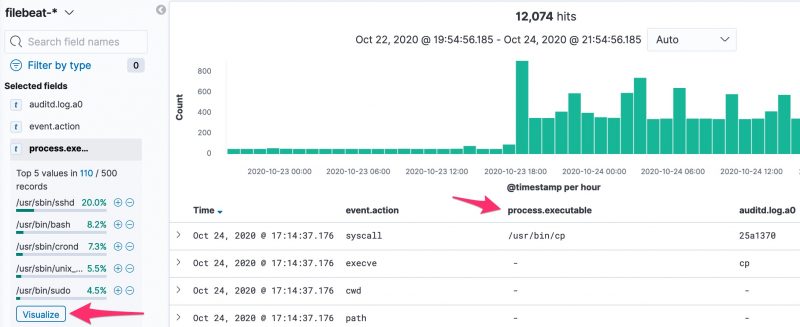
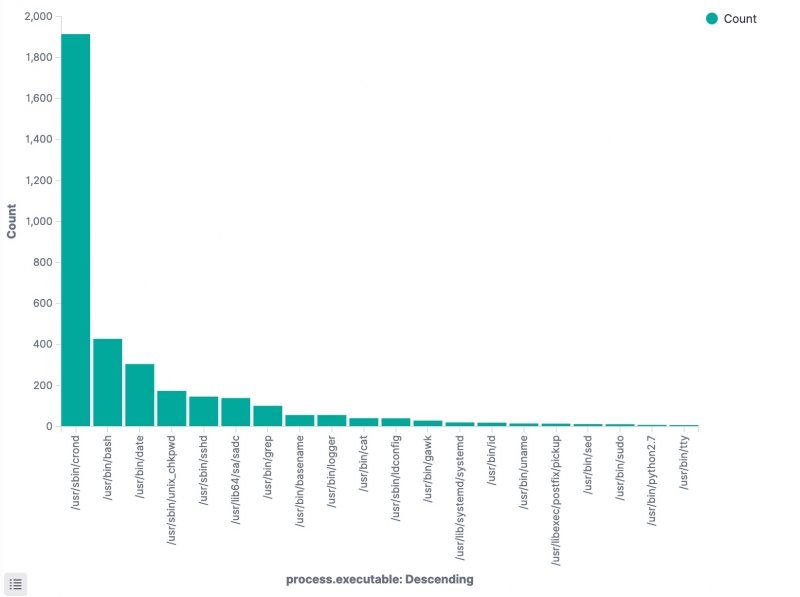
Apart from the method above, there’s another interesting option to track which processes have been executed. In the Discover section of Kibana, add process.executable as one of the columns to display. The field list on the left has a button Visualize, which provides you direct access to visually represent all the process executions.
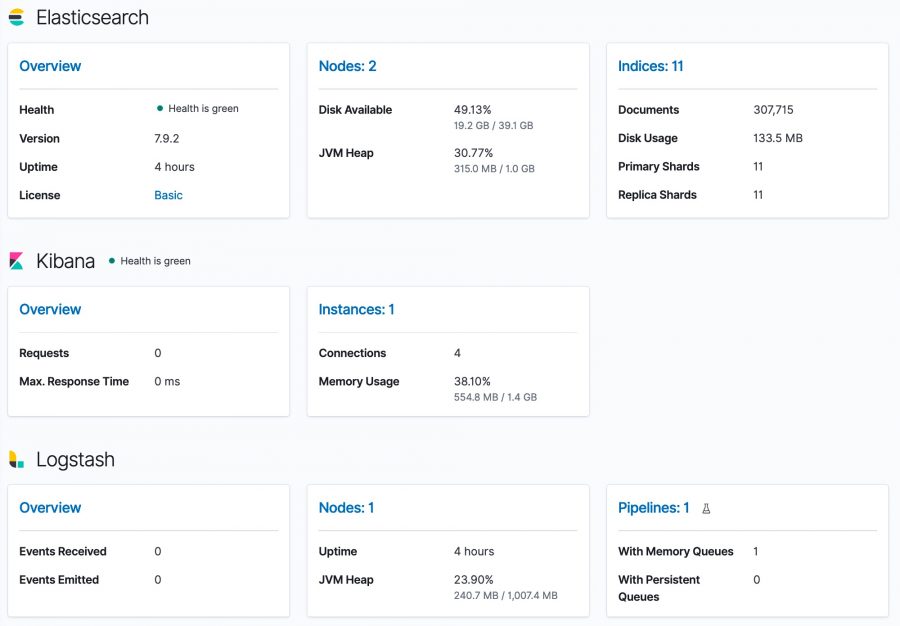
Monitor the stack
Optionally you can also install Stack Monitoring to monitor the statistics and health of the Elastic stack. Under the Management menu, choose Stack Monitoring and then choose self monitoring.


hey i get an error stating ubuntu@one-cloud:~/elastic-dfir-cluster$ docker run -d –net=elastic –name=filebeat –volume=”$(pwd)/filebeat/filebeat.docker.yml:/usr/share/filebeat/filebeat.yml:ro” –volume=”/home/dfir/elastic/logs/:/volume/:ro” -e -strict.perms=false docker.elastic.co/beats/filebeat:7.9.2 filebeat
7c6b9a2c9dc9e7b7e9f1ef28c36c586439123754ecd84f47c4719add3e6a0b27
docker: Error response from daemon: Could not attach to network elastic: rpc error: code = NotFound desc = network elastic not found.
Hello,
Maybe try with another network-name such as “elastic-dfir-cluster_elastic”?
kr,
koen