VMware ESXi with support for NUC-11 network interface

NUC-11

The Intel NUC Mini PCs are great mini computers to run VMware ESXi. Unfortunately, the image of VMware ESXi 7 doesn’t support the network drivers of the NUC 11th generation. A post on https://www.virten.net/2021/11/vmware-esxi-7-0-update-3-on-intel-nuc/ describes how to create a new image, with support for the network driver. I put this post here primarily as a personal reminder.

VMware imagebuilder

The image is build with VMware PowerCLI.

Set-ExecutionPolicy -ExecutionPolicy AllSigned
Import-Module VMware.ImageBuilder

Now download the ESXi offline image and the network driver. Then start PowerShell and navigate to the location where you have downloaded the files.

Add the image file

Add-EsxSoftwareDepot .\VMware-ESXi-7.0U2a-17867351-depot.zip
 
Depot Url
---------
zip:C:\Users\User\Desktop\vmware\VMware-ESXi-7.0U2a-17867351-depot.zip?index.xml

Then add the network driver

Add-EsxSoftwareDepot .\Net-Community-Driver_1.2.2.0-1vmw.700.1.0.15843807_18835109.zip

Depot Url
---------
zip:C:\Users\User\Desktop\vmware\Net-Community-Driver_1.2.2.0-1vmw.700.1.0.15843807_18835109.zip?index.xml

Now define a new ESX image and add the software packages.

New-EsxImageProfile -CloneProfile "ESXi-7.0U2a-17867351-standard" -Name "ESXi-7.0U2a-17867351-NUC" -Vendor "virten.net"

Name                           Vendor          Last Modified   Acceptance Level
----                           ------          -------------   ----------------
ESXi-7.0U2a-17867351-NUC       virten.net      29/04/2021 0... PartnerSupported
Add-EsxSoftwarePackage -ImageProfile "ESXi-7.0U2a-17867351-NUC" -SoftwarePackage "net-community"

Name                           Vendor          Last Modified   Acceptance Level
----                           ------          -------------   ----------------
ESXi-7.0U2a-17867351-NUC       virten.net      23/11/2021 1... PartnerSupported

And then as a final step, build the ISO image.

Export-ESXImageProfile -ImageProfile "ESXi-7.0U2a-17867351-NUC" -ExportToISO -filepath ESXi-7.0U2a-17867351-NUC.iso

This ISO image is the image to write to an USB drive which you can then use to boot your NUC.

How Attackers Exploit the Remote Desktop Protocol

I published an article on the IBM Security Intelligence blog : How Attackers Exploit the Remote Desktop Protocol.

This article covers the Remote Desktop Protocol (RDP) and how attackers attempt to exploit it. I provide a short introduction on what is RDP and who uses it and highlight some of its vulnerabilities, such as BlueKeep and DejaBlue. The article also includes a number of countermeasures that you can use to protect your RDP servers and which monitoring and forensic artifacts that are useful in case of incident response for RDP.

Read more at https://securityintelligence.com/articles/exploiting-remote-desktop-protocol/.

Parsing the O365 Unified Audit Log with Python

Unified Audit Log

The Unified Audit Log contains crucial elements when you want to investigate an incident in O365. You can do this live (with PowerShell, for example via Hawk). Sometimes however you receive the log file offline, with no live access to the environment.

I could not find a tool that gives me a quick overview of what was in the log. So I decided to write my own simple Python script to parse the exported O365 Unified Audit Log.

The exported Unified Audit Log is in CSV and basically you only need the first field of that CSV file, AuditData. This field is a JSON set of data with all the useful data.

Test data

There is a public data set containing Office 365 Unified Audit Logs for security research and detection. I used this data set to demonstrate/tune the script. The screenshots in this post are made with running the script on that data set.

Script

I was interested in the type of operations taking place, from where they are initiated and which objects they manipulated. And this is exactly what the script outputs. There’s plenty of room for improvement but for now it returns the results I’m interested in.

  • Overview of basic elements of the log file
  • Type of operations
  • Client IPs

You can find the script on Github https://github.com/cudeso/tools/blob/master/O365-python-parse/o365-python-parse.py.

Overview of the log


Client IPs

Type of operations taking place

Update 20230214

Added support for simple output to CSV via https://github.com/cudeso/tools/commit/7e3132c6e727cbfdb732a26532785e7bb3af232e.

When Is an Attack not an Attack? The Story of Red Team Versus Blue Team

I published an article on the IBM Security Intelligence blog : When Is an Attack not an Attack? The Story of Red Team Versus Blue Team. This article is a high level overview of a red team vs blue team engagement. It starts with the reconnaissance of the victim, the red team scenario building, attack delivery and also how the blue team can discover the activities from the read team.

Read more at https://securityintelligence.com/articles/red-team-versus-blue-team-attack/.

Install Elastic Filebeat as daemon on OSX

Filebeat

Filebeat is a lightweight shipper for logs. You can use it to collect logs from endpoints and store them centrally in Elastic. You can use it to collect logs from Linux systems, but it also works on Apple OSX. Installing filebeat is straightforward

curl -L -O https://artifacts.elastic.co/downloads/beats/filebeat/filebeat-7.15.0-darwin-x86_64.tar.gz
tar xzvf filebeat-7.15.0-darwin-x86_64.tar.gz
ln -s filebeat-7.15.0-darwin-x86_64 filebeat

After installing filebeat you have to enable the system module

sudo filebeat/filebeat enable system

Then update the configuration file (filebeat/filebeat.yml)

- type: log
  enabled: true
  paths:
    - /var/log/install.log

setup.ilm.enabled: auto
setup.ilm.rollover_alias: "filebeat-cudeso"
setup.ilm.pattern: "{now}-000001"
setup.ilm.policy_name: "filebeat-cudeso"

output.elasticsearch:
  hosts: ["elastic:9200"]

Daemon

I used the information from a support post on the Elastic site: https://discuss.elastic.co/t/deploying-filebeat-on-macos-x/37785/11. This post describes what needs to be in the plist and how to add it to launchd.

Create the file /Library/LaunchDaemons/co.elastic.filebeat.plist

<?xml version="1.0" encoding="UTF-8"?>
<!DOCTYPE plist PUBLIC "-//Apple//DTD PLIST 1.0//EN" "http://www.apple.com/DTDs/PropertyList-1.0.dtd">
<plist version="1.0">
<dict>
    <key>Label</key>
    <string>co.elastic.filebeat</string>
    <key>ProgramArguments</key>
    <array>
        <string>/Users/john/Scripts/filebeat/filebeat</string>
        <string>-c</string>
        <string>/Users/john/Scripts/filebeat/filebeat.yml</string>
	<string>--strict.perms=false</string>
    </array>
    <key>KeepAlive</key>
    <true/>
</dict>
</plist>

Register the daemon

launchctl load /Library/LaunchDaemons/co.elastic.filebeat.plist 

Then verify the daemon is running and check the filebeat logs.

Use Mobile Verification Tool to check if your iPhone is affected by Pegasus spyware

Pegasus

The Pegasus spyware made by the Israel-based company NSO Group has been used in targeted surveillance attacks against activists, journalists and businesspeople. Its details, and methods to detect it, were revealed by CitizenLab (hacks from the Bahraini government on activists) with a forensic methodology report made available by Amnesty International.

Because both the tools and the indicators of compromise are made available it’s fairly easy to do these checks yourself.

Environment

Setup a Python virtual environment with python 3 and activate the virtual environment.

virtualenv mvt
source mvt/bin/activate

Install the Mobile Verification Toolkit in that virtual environment.

pip3 install mvt

Get a backup from your iPhone. If you do backups with an Apple computer (OSX) you can find them at

/Users/John/Library/Application Support/MobileSync/Backup

Copy the latest backup to the Linux environment where you installed mvt. Note that you can install mvt also on your OSX but I prefer to use it in a Linux system.

You then have to decrypt the backup.

mvt-ios decrypt-backup -p -d /path/to/decrypted_iphone /path/to/backup

Make sure that /path/to/backup is local to the system where you run mvt. I was unable to execute it when the iPhone backup was mounted via a remote file system.

Fetch the latest indicators from https://github.com/AmnestyTech/investigations/tree/master/2021-07-18_nso. These are in STIX2 format, you need the file pegasus.stix2.

Then verify your decrypted backup.

mvt-ios check-backup -i pegasus.stix2 -o /path/to/output /path/to/decrypted_iphone

It’s not abnormal to see a list of warnings or errors.

In the output folder you’ll find a bunch of JSON files. Check if any of these files contain a suffix _detected.

Delete the decrypted backup from your system, as well as the output files.

Identify malicious servers / Cobalt Strike servers with JARM

For a new assignment I wanted to use JARM to group servers with a similar configuration. Why JARM? Because it’s an easy way to quickly identify and group servers based on their configuration.

What is JARM?

JARM is an active fingerprinting of TLS servers made available by Salesforce Engineering. It sends 10 TLS Client Hello packets to a server and captures specific attributes of the responses. These responses are then aggregated and hashed. A JARM fingerprint consists of 62 characters where:

  • The first 30 characters cover the ciphers and TLS version chosen by the server;
  • The remaining 32 characters are based on the extensions sent by the server.

Important to realise is that JARM is not an identification if a server is malicious or not, it is just an identification is a server has a configuration corresponding with a specific fingerprint. And although it’s not an identification if a server is malicious, because C2 servers for a specific campaign are often configured similarly, this provides a fingerprint to highlight the malicious servers once you have identified the configuration of one such server.

You can create a JARM fingerprint yourself with the code at Github. But instead of then doing a large network scan and checking the fingerprint of the servers, you can use Shodan. Shodan allows you to query for all the servers with a specific JARM fingerprint with the query

ssl.jarm:<JARM>

The advantage of using Shodan is obvious. Although JARM is an active fingerprinting tool, by using it via Shodan you can fingerprint the servers passively. You create a JARM fingerprint from one server and then use Shodan to identify which other servers are out there, without sending packets to these servers.

Cobalt Strike servers

Cobalt Strike servers are typically not the type of servers you want to see in your network range.

As an example for identifying servers based on a configuration fingerprint, you can use one of the known JARM fingerprints of Cobalt Strike servers, such as those from Michael Koczwara.

Python script

I wrote a short Python script that takes a list of JARM fingerprints, queries Shodan for these fingerprints and then dumps the hostname and the CN field that was found in the SSL certificate.

In this script

  • Add your Shodan API key in SHODAN_API_KEY;
  • Store the JARM fingerprints in the file jarm.txt;
  • The detailed output of the query is stored in results.txt;
  • The important details of the query, meaning JARM fingerprint, IP and hostname are stored in output.txt.

import shodan
import sys
import json

SHODAN_API_KEY = ""
country="be"
network=""
hits = 0
api = shodan.Shodan(SHODAN_API_KEY)

try:
    f = open('jarm.txt','r')
    f_result = open('results.txt','w')
    f_output = open('output.txt', 'w')
    f_result.close()
    f_output.close()

    f_result = open('results.txt','a')
    f_output = open('output.txt', 'a')

    for jarm in f:
        jarm_strip = jarm.strip()
        results = api.search("ssl.jarm:{} country:{}".format(jarm_strip, country))
        #results = api.search("ssl.jarm:{} country:{} network:{}".format(jarm_strip, country, network))
        f_result.write(json.dumps(results))
        f_result.write("\n")
        for result in results['matches']:
            hits += 1
            print("{} {} {} {} {}".format(jarm_strip, result['ip_str'], result['isp'], result['hostnames'], result['ssl']['cert']['subject']))
            f_output.write("{} {} {} {} {}\n".format(jarm_strip, result['ip_str'], result['isp'], result['hostnames'], result['ssl']['cert']['subject']))

    print("Hits: {}".format(hits))

    f_result.close()
    f_output.close()
except Exception as e:
    raise e

False positives with JARM

A JARM fingerprint is only a fingerprint indicating a server has a similar configuration. As such, it’s only a first identification for triaging if a server should be further investigated. When I was compiling a list of JARM fingerprints for Cobalt Strike servers I noticed that some of the highlighted servers are related to Zimbra Collaboration servers.

Out of the 90 servers detected with JARM fingerprint 05d02d20d21d20d05c05d02d05d20dd7fc4c7c6ef19b77a4ca0787979cdc13, 24 turned out to be related to a Zimbra Collaboration Server.

(shodan) koenv@ir:~/shodan$ cat output.txt |grep -i zimbra | cut -d ' ' -f 1 | uniq -c
     24 05d02d20d21d20d05c05d02d05d20dd7fc4c7c6ef19b77a4ca0787979cdc13
(shodan) koenv@ir:~/shodan$ cat output.txt | grep 05d02d20d21d20d05c05d02d05d20dd7fc4c7c6ef19b77a4ca0787979cdc13 | wc -l
90

Conclusion

Once you have identified/created a suitable JARM fingerprint, Shodan is an excellent resource to locate additional servers corresponding to your fingerprint, without having to touch any of these servers.

Cobalt Strike Hunting – Key items to look for

Cobalt Strike

Cobalt Strike (S0154) is a commercial penetration testing platform which is used by many red teams and, unfortunately, also by many criminal threat actors. In this post I summarise the findings from a SANS Digital Forensics and Incident Response keynote by Chad Tilbury : Cobalt Strike Threat Hunting. The YouTube video provides much more details but below you can find those findings that were relevant for me during an IR case.

This post includes references to commands of the Volatility memory forensics platform but you can use any platform of your choice. Some of the logs sources that are valuable during IR such as network traffic (detect beaconing, traffic frequency), PowerShell logs and Sysmon logs were unfortunately not available.

Hunting

Process tree

Look at running processes and the process tree via pstree. Two anomalies to look for are:

  • PowerShell spawning itself;
  • PowerShell spawning (multiple) rundll32.exe processes.

Rundll32.exe is spawned as a sacrificial process in which Cobalt Strike injects its malicious code. By default, Cobalt Strike will spawn rundll32.exe. This is customisable and can as well be svchost.exe or any other process. The take-away is to look for multiple, similar, processes all spawned from PowerShell.

Command line arguments rundll32

The next item to look for are the command line arguments that are used for starting rundll32.exe from PowerShell.

If you notice a rundll32.exe process spawned from PowerShell without any DLL supplied as an argument then there is a high chance that something is wrong. By default Cobalt Strike spawns rundll32.exe without arguments but this is also customisable. If you observe multiple rundll32.exe processes (or for example svchost.exe) spawned with the same command line parameters or all without command line arguments then there’s a high chance it’s Cobalt Strike.

32-bit version PowerShell

Review if a 32-bit version of PowerShell was used to launch the subprocesses. You can detect this by looking at the startup path (via cmdline) of the command. If it includes syswow64 (take note of different forms of capitalisation) then it’s using the 32-bit version.

Execute and Write memory pages

You can find injected code with malfind which allows you to find ‘hidden’ or injected DLLs in user memory. Pay special attention to the memory pages that are marked both as executable and writable. Don’t be confused if the first page only contains zeros. Cobalt Strike can will not inject its code in the first page but you’ll be able to find the injected code after the set of zeros.

Named pipes

The default configuration of Cobalt Strike uses named pipes for the communication between different processes:

  • \\.\pipe\MSSE-###-server (default Artifact Kit binaries)
  • \\.\pipe\status_## (payload staging for lateral movement)
  • \\[target]\pipe\msagent_## (SMB beacon)
  • \\.\pipe\postex_ssh_#### (SSH sessions)
  • \\.\pipe\postex_#### (post exploitation)
  • \\.\pipe\####### (7-10 #s) (post exploitation before version 4.2)

The configuration of these named pipes can be changed, but in a lot of cases attackers will just stick to the default settings.

In Volatility you can list the named pipes via the handles command and specify the process PID. Note that the list of named pipes can provide you hints of other machines most likely also affected by the intrusion (for example if the named pipe has references to machine names/IPs for post exploitation or SMB beacons).

For an initial triage and to reduce the volume of results it makes sense to look only

  • at processes which normally would not use named pipes;
  • for 32-bit processes (syswow32) using named pipes;
  • or for named pipes with a seaming-less random name.

As an additional note, the number of characters of the name of the named pipe is a giveaway for what command is being issued. For example mimikatz (8 chars) will have a named pipe name of 8 characters long. Also see the blog of F-Secure Detecting Cobalt Strike Default Modules via Named Pipe Analysis and a list of malleable profiles (including the different pipe names) from Michael Haag.

A last remark on named pipes. Because Cobalt Strike uses named pipes to deliver shellcode you should make sure your sandbox emulates named pipes as otherwise Cobalt Strike might not find its shellcode. See also the blog from NVISO Anatomy of Cobalt Strike’s DLL Stager.

PowerShell logging

PowerShell logging is essential to further identify Cobalt Strike activity. Because so many attacks make use of PowerShell in one way or another (not only for Cobalt Strike), it is a treasure cave for doing incident response. Unfortunately PowerShell auditing (logging) is not always enabled in corporate environments (as was the case for the IR for which I did this post).

If you do have PowerShell logging enabled, then look for

  • DownloadString / IEX downloads for localhost (http://127.0.0.1);
  • Large blocks of encoded PowerShell (FromBase64String, EncodedCommand);
  • System.Reflection or ReflectedDelegate.

Crowdstrike has an overview of PowerShell log observations of Cobalt Strike commands: Getting the Bacon from the Beacon.

Extract Cobalt Strike configuration

If you have a memory dump of a system running Cobalt Strike then you can use the 1768.py tool from Didier Stevens to decrypt and dump the configuration file of the Cobalt Strike beacon. The tool will scan the memory dump, look for the XOR key and then decrypt and dump the configuration of the beacon. You can dump the configuration in tabular output, CSV or JSON.


Image from https://blog.didierstevens.com/2020/11/07/1768-k/

The dump of the configuration file gives you immediate access to the named pipes, the C2 server (name, port and URI) and the HTTP user agent used for beaconing. All this information is something you can use to further identify compromised devices.

Sigma rules

There are a couple of Sigma rules that you can use to detect Cobalt Strike :

Summary

PowerShell spawning itself
PowerShell spawning (multiple) rundll32.exe processes
Multiple rundll32.exe with no command line arguments or all with the same command line arguments
32-bit version of PowerShell started (via syswow64)
Memory set as EXECUTE and WRITE
List of default Cobalt Strike named pipes
PowerShell downloads for http:/127.0.0.1
Encoded PowerShell

Update 20210914

These resources provide additional useful information for detecting and fighting Cobalt Strike:

  • Cobalt Strike, a Defender’s Guide: A very extensive guide with information on which Event IDs to look for during the different stages, such as Execution, Defense Evasion, Discovery, Privilege Escalation, …
  • Awesome-CobaltStrike-Defence: A Github repository with pointers to hunting and detection tools, Yara and Sigma rules and indicators of compromise.

Legal and cooperation frameworks between CSIRTs and law enforcement agencies

For a recent assignment, I had to summarise some of the legislation and cooperation frameworks that exist between CSIRTs and law enforcement agencies. This list is certainly not complete but already gives you an overview of what’s available. I first list the frameworks and then provide an overview of some of the existing cooperation mechanisms.

Legal Frameworks


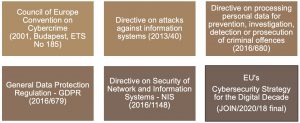
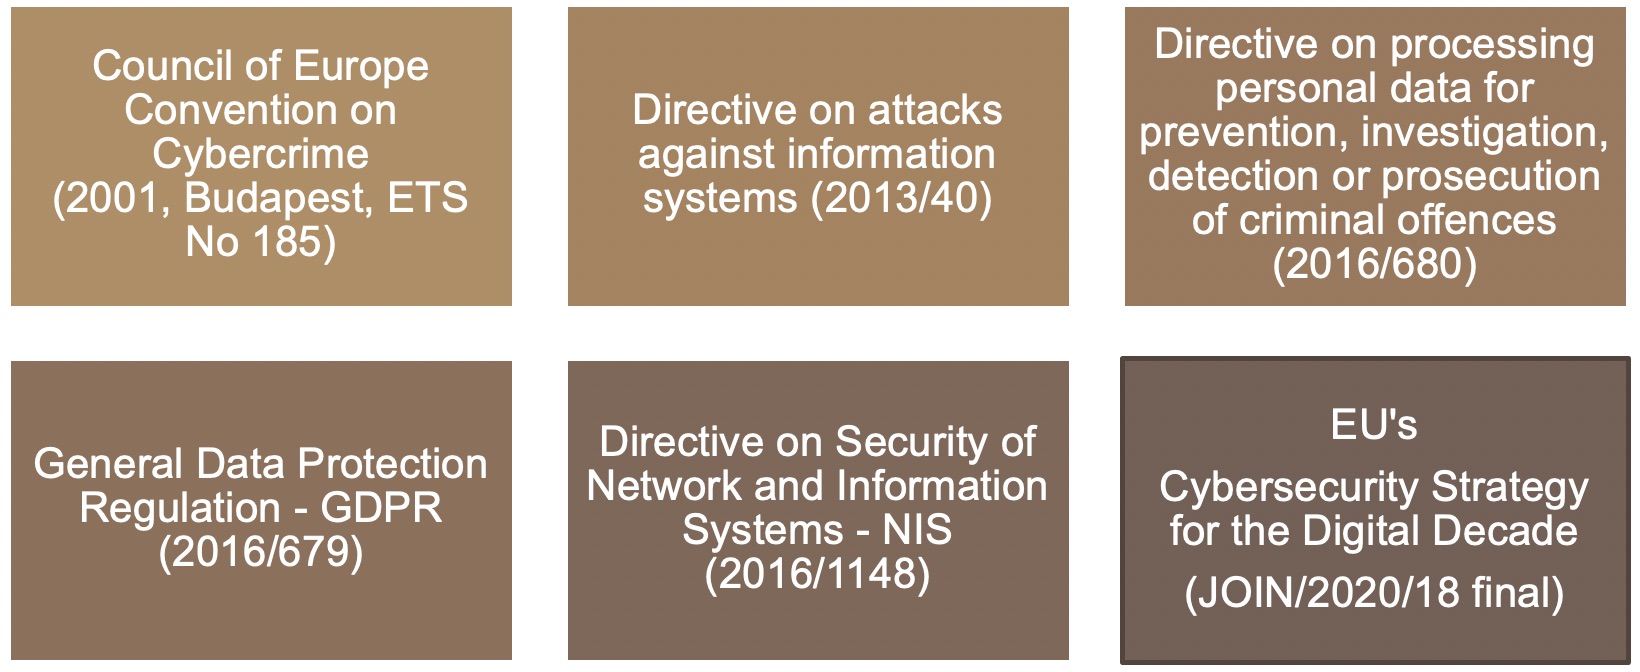
Council of Europe Convention on Cybercrime  (Budapest, ETS No 185)

2001 – International

This convention, also known as the Budapest Convention is the first international treaty to address Internet and computer crime. The treaty focused on harmonising laws and increasing cooperation across borders so that cybercrime could be prosecuted in the countries affected. The treaty had three main objectives

  • harmonising national laws that dealt with cyber-related crime;
  • supporting the investigation of cyber-related crimes;
  • increase the international cooperation in the fight against cybercrime.

Full text can be found at coe.int.

Directive on attacks against information systems (2013/40)

2013 – Europe

This directive imposes new obligations, tasks and expectations on certain key stakeholders, including CERTs/CSIRTs, LEAs, security specialists, telecommunications service providers. These relate mainly to the operation of the existing 24/7 contact points (introducing a response deadline obligation within 8 hours), improving criminal justice/police cooperation, and the obligation to strengthen statistical data collection in order to support accountability and rational policy making.

The Directive is well known because it establishes the criminalisation of certain tools for committing offenses

This is a directive, which needs to be transposed into national law in all individual member states of Europe.

Full text can be found at eur-lex.europa.

Directive on processing personal data for prevention, investigation, detection or prosecution of criminal offences (2016/680)

2016 – Europe

This directive regulates the processing of data by police and criminal justice authorities in the EU. The Directive requires the data collected by law enforcement authorities to be processed lawfully and fairly, collected for specified, explicit and legitimate purposes. The data can also only be kept in a form that allows identification of the individual for no longer than is necessary. The Directive requires that the law enforcement authorities make a clear distinction between the data of different categories of persons.

This is a directive, which needs to be transposed into national law in all individual member states of Europe.

Full text can be found at eur-lex.europa.

General Data Protection Regulation – GDPR (2016/679)

2016 – Europe

The GDPR is the privacy data law that is designed to harmonise and update data protection requirements in the European Union. The primary objectives of the GDPR are to give control of personal data to EU citizens and residents. GDPR also simplifies the regulatory environment for international business within the EU.

Contrary to a directive, a regulation does not need to be transposed into national law, it immediately applies.

Full text can be found at eur-lex.europa.

Directive on Security of Network and Information Systems – NIS (2016/1148)

2016 – Europe

The EU’s NIS Directive (Directive on security of network and information systems) is the first piece of EU-wide cyber security legislation. It aims to achieve a high common level of network and information system security across the EU’s critical infrastructure. It sets a range of network and information security requirements which apply to operators of essential services and digital service providers (DSPs).

This is a directive, which needs to be transposed into national law in all individual member states of Europe.

Full text can be found at eur-lex.europa.

EU’s Cybersecurity Strategy for the Digital Decade (JOIN/2020/18)

2020 – Europe

The EU Cybersecurity Strategy focusses on building the operational capacity to prevent, deter and respond to cyber incidents. One of the major focal points to increase the operational capacity is to establish a Joint Cyber Unit (JCU) to speed up information sharing between different cybersecurity communities in the EU. It also focusses on increased cooperation and strengthening collective capabilities to respond to major cyberattacks.

Full text can be found at eur-lex.europa.

Cooperation Mechanisms

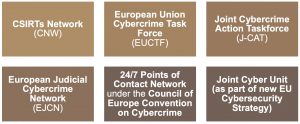
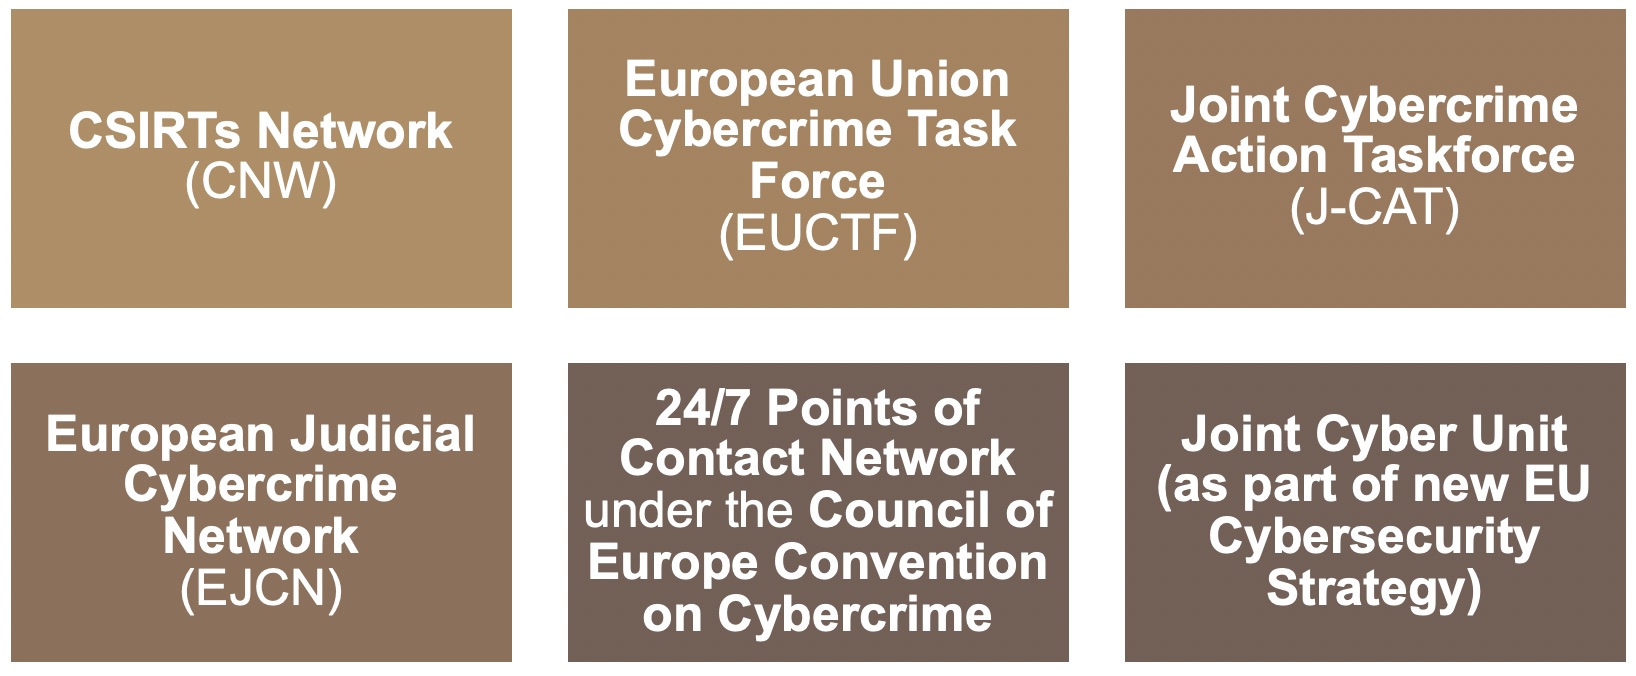
CSIRTs Network (CNW)

The CSIRTs Network is a network composed of EU Member States’ appointed CSIRTs and CERT-EU. The European Commission participates in the network as an observer. ENISA is tasked to actively support the CSIRTs cooperation, provide the secretariat and active support for incident coordination upon request. The CSIRTs Network provides a forum where members can cooperate, exchange information and build trust. Members will be able to improve the handling of cross-border incidents and even discuss how to respond in a coordinated manner to specific incidents.

European Union Cybercrime Task Force (EUCTF)

The EUCTF is a trust based network which meets twice yearly at Europol and provides a forum for the heads of the EU cybercrime units and associated countries (Denmark, Iceland, Norway and Switzerland), together with EUROPOL, CEPOL, EUROJUST and DG HOME to identify, discuss and prioritise the key challenges and actions in the fight against cybercrime. The mission statement of EUCTF is to develop and promote a harmonised approach within the European Union to the criminal misuse of information and communication technology and the fight against cybercrime.

Joint Cybercrime Action Taskforce (J-CAT)

The Joint Cybercrime Action Taskforce (J-CAT), launched in September 2014 helps fighting cybercrime within and outside the EU. J-CAT’s objective is to drive intelligence-led, coordinated action against key cybercrime threats and targets by facilitating the joint identification, prioritisation, preparation, initiation and execution of cross-border investigations and operations by its partners. It consists of 9 EU Member States, 7 non-EU partner countries and Europol.

European Judicial Cybercrime Network (EJCN)

The European Judicial Cybercrime Network (EJCN) was established in 2016 to foster contacts between practitioners specialised in countering the challenges posed by cybercrime, cyber-enabled crime and investigations in cyberspace, and to increase the efficiency of investigations and prosecutions. Eurojust is a key partner of the EJCN, especially in situations in which the Network deals with the numerous challenges related to the genuinely borderless nature of cybercrime.

24/7 Points of Contact Network

This network was constructed under the Council of Europe Convention on Cybercrime

Joint Cyber Unit

The JCU is part of the new EU Cybersecurity Strategy and has as goal to speed up information sharing between different cybersecurity communities in the EU.

MISP and Threat Intelligence

I shared a presentation with a high-level overview of Threat Intelligence and MISP on the MISP Presentation Github repository.


Have a look at MISP/MISP-presentations 2021. The deck also includes one slide for using MISP in an industrial / ICS environment. Both PPTX and PDF versions are shared.