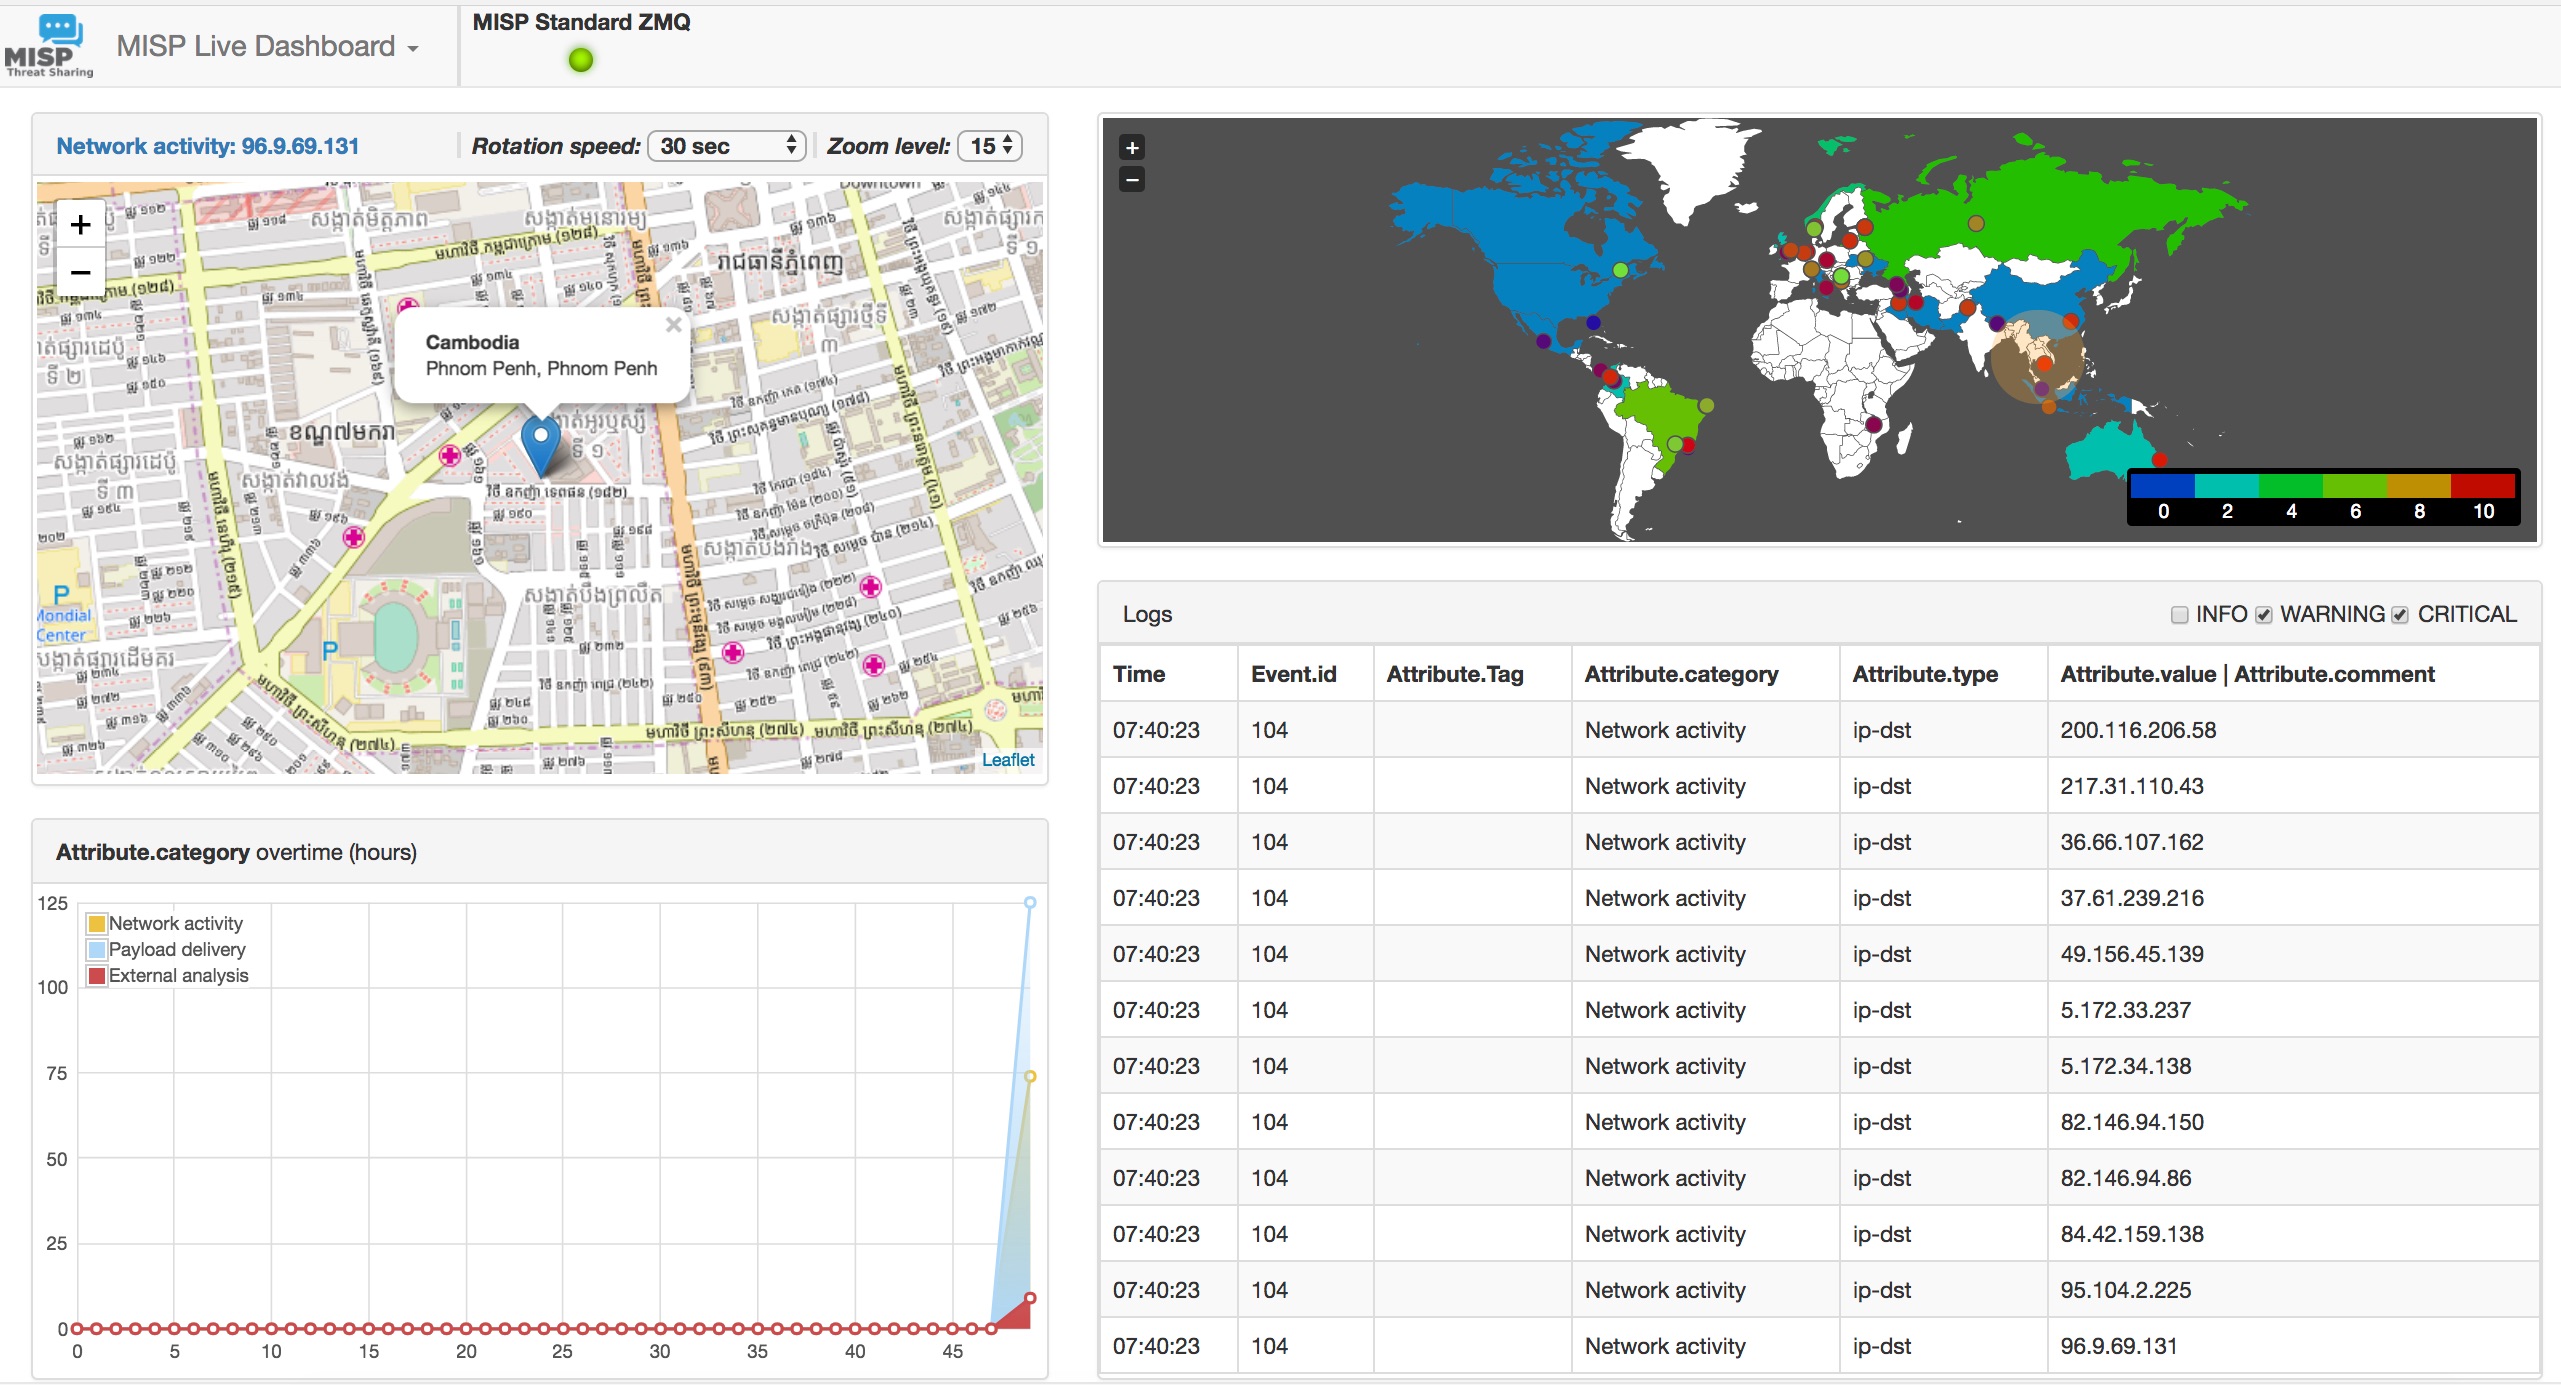
MISP-Dashboard, real-time visualization of MISP events
You are running a MISP instance and you want to visualize the MISP events in real-time?
MISP-Dashboard can do that! An example :
Vimeo video :
In this post I will walk you through how to setup MISP-Dashboard, based on the event data made available via botvrij.eu.
MISP-Dashboard
MISP-Dashboard is a new repository showing live data and statistics from the MISP ZMQ. It means you need to have MISP-ZMQ configured.
MISP-ZMQ
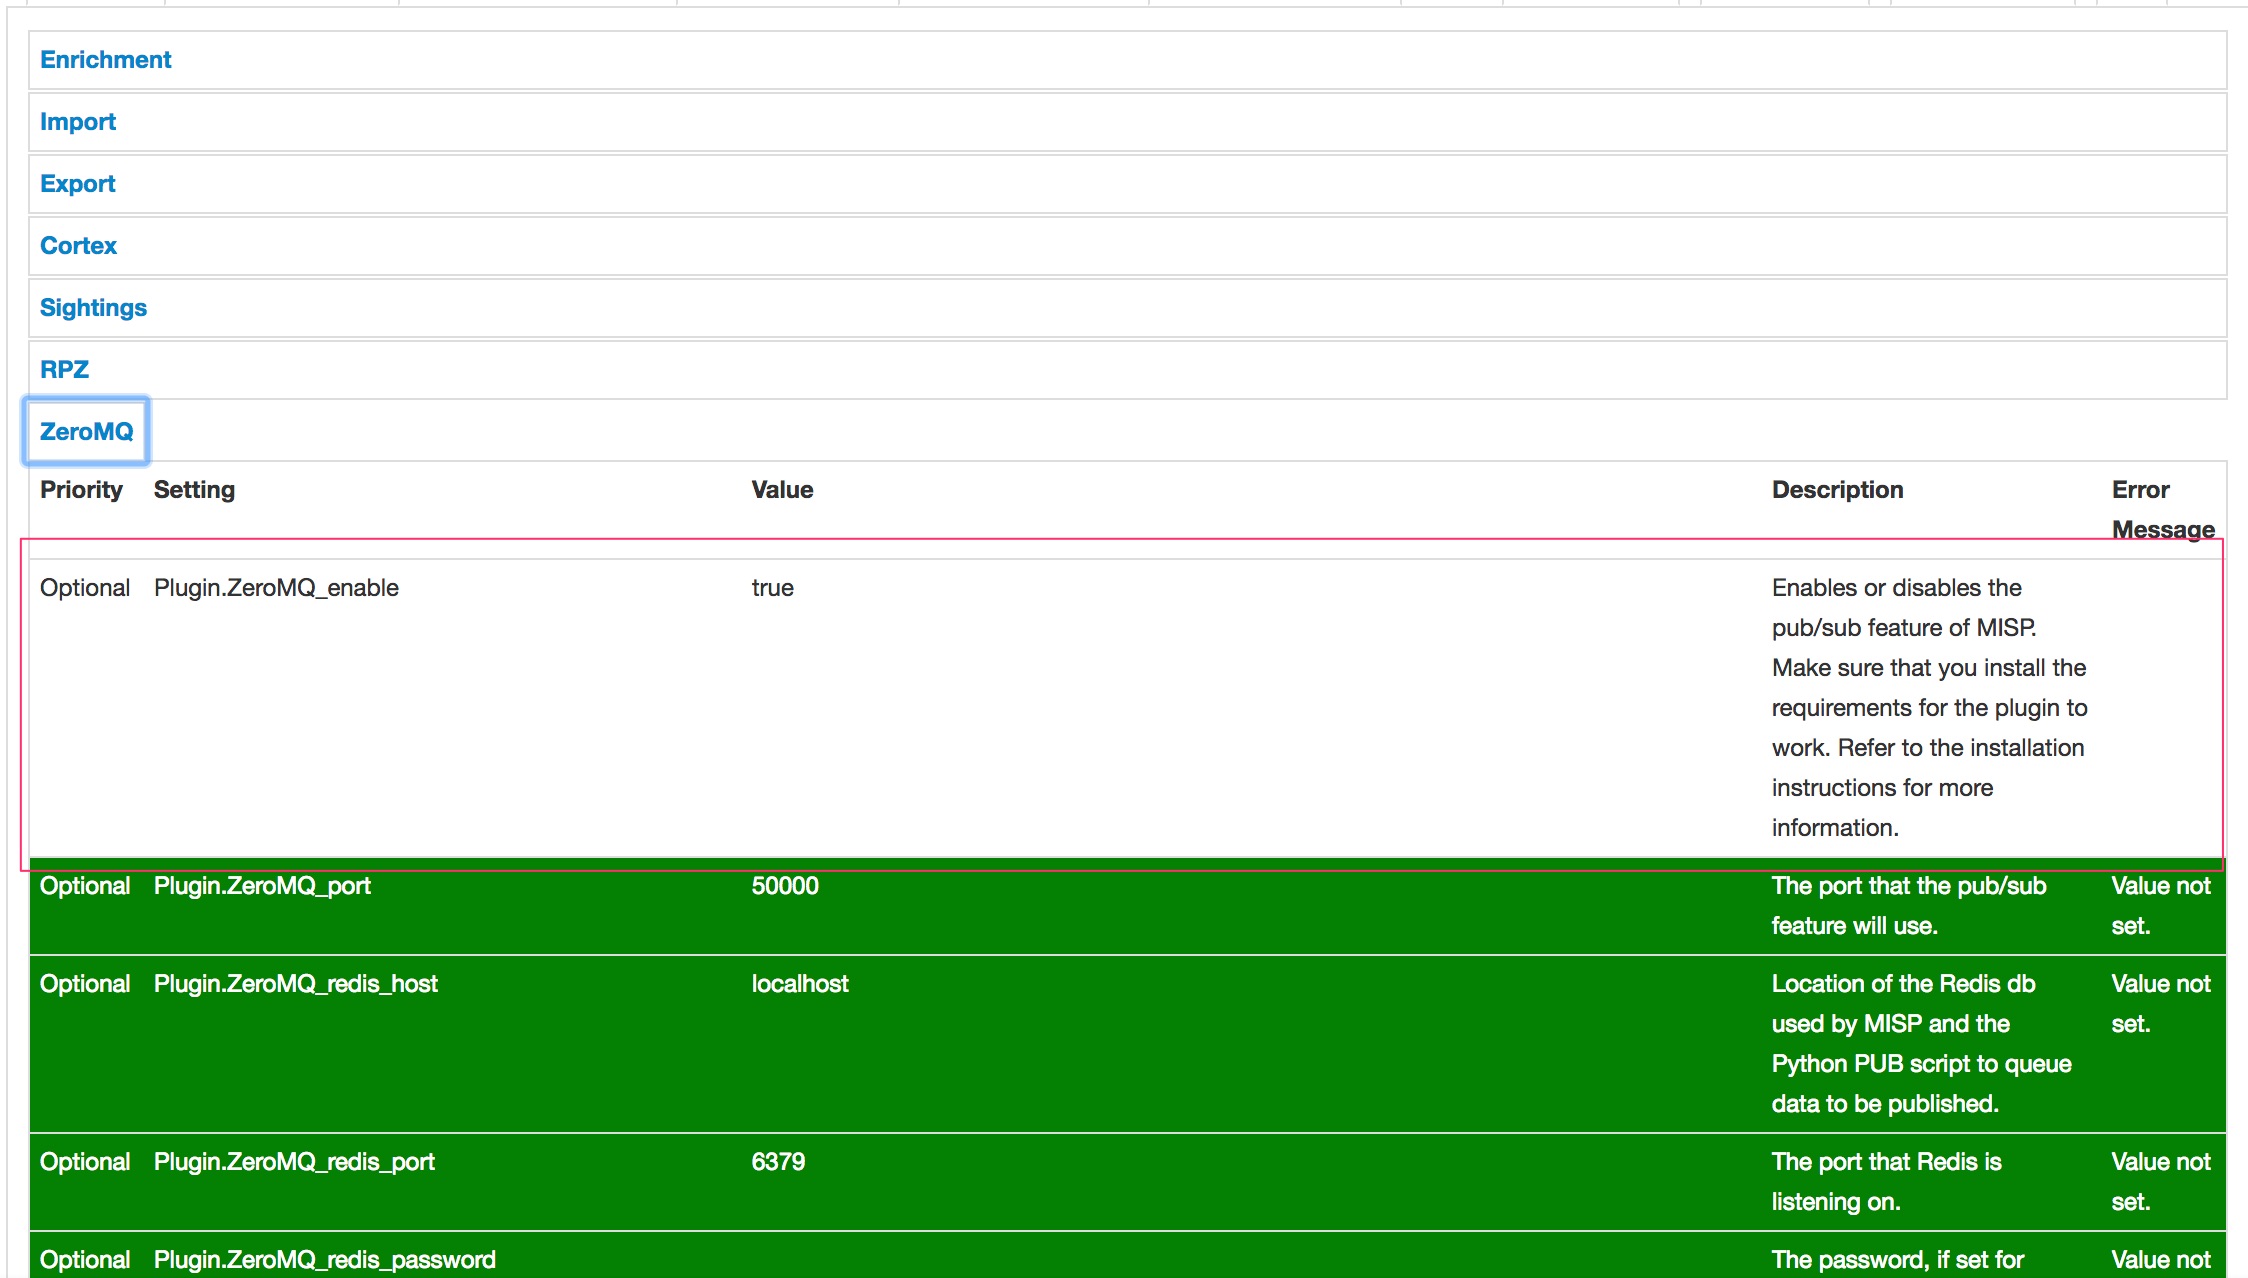
The MISP ZeroMQ plugin allows real-time integration of the MISP activities (event publication, attribute creation or removal, sighting) via a flexible publish-subscribe model. The configuration and setup is described in the MISP handbook.
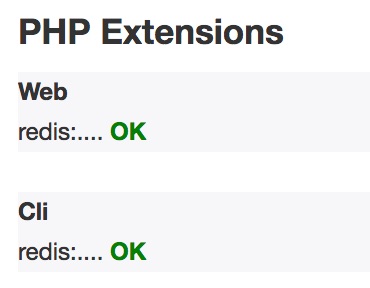
In essence you need to enable ZeroMQ in the MISP plugins. Before doing so (if not already done), make sure that there is PHP support for Redis
sudo apt-get install php-redis
Install MISP-Dashboard
Fetch the latest MISP-Dashboard repository.
git clone https://github.com/MISP/misp-dashboard.git
The repository contains a script to install dependencies but in my setup this did not cover everything. So I had to install these dependencies manually
sudo apt-get install python-virtualenv libzmq5-dev python3-dev python3-zmq
and then install the required dependencies (make sure you are in the directory of misp-dashboard)
./install_dependencies.sh
MISP-Dashboard also needs Flask (for the dashboard webserver) and redis support for Python.
sudo apt-get install python3-flask python3-redis
Configure MISP-Dashboard
The configuration of MISP-Dashboard can be found in the file config/config.cfg. I kept most of the default settings, except these
[RedisGlobal]
host=localhost
port=6379

[RedisLog]
db=0
channel=1
zmq_url=tcp://localhost:50000
Start MISP-Dashboard
You must first activate your virtualenv
. ./DASHENV/bin/activate
and then listen to the MISP feed by starting the zmq_subscribe
./zmq_subscriber.py
The visualization is done via Flesk. By default Flesk will run on localhost. You can either change this or tunnel the port via an SSH connection
ssh -L 8001:127.0.0.1:8001 misp.myhost.tld
Start the server (also from the virtualenv)
. ./DASHENV/bin/activate
./server.py
Patch MISP-Dashboard
When I ran zmq_subscribe and published an event to ZeroMQ I got an error
redis.exceptions.ResponseError: unknown command 'GEOADD'
I temporarily patched it by disabling serv_redis_db.geoadd in the function push_to_redis_geo
def push_to_redis_geo(keyCateg, lon, lat, content):
    now = datetime.datetime.now()
    today_str = str(now.year)+str(now.month)+str(now.day)
    keyname = "{}:{}".format(keyCateg, today_str)
    #serv_redis_db.geoadd(keyname, lon, lat, content)
Also see https://github.com/MISP/misp-dashboard/issues/1
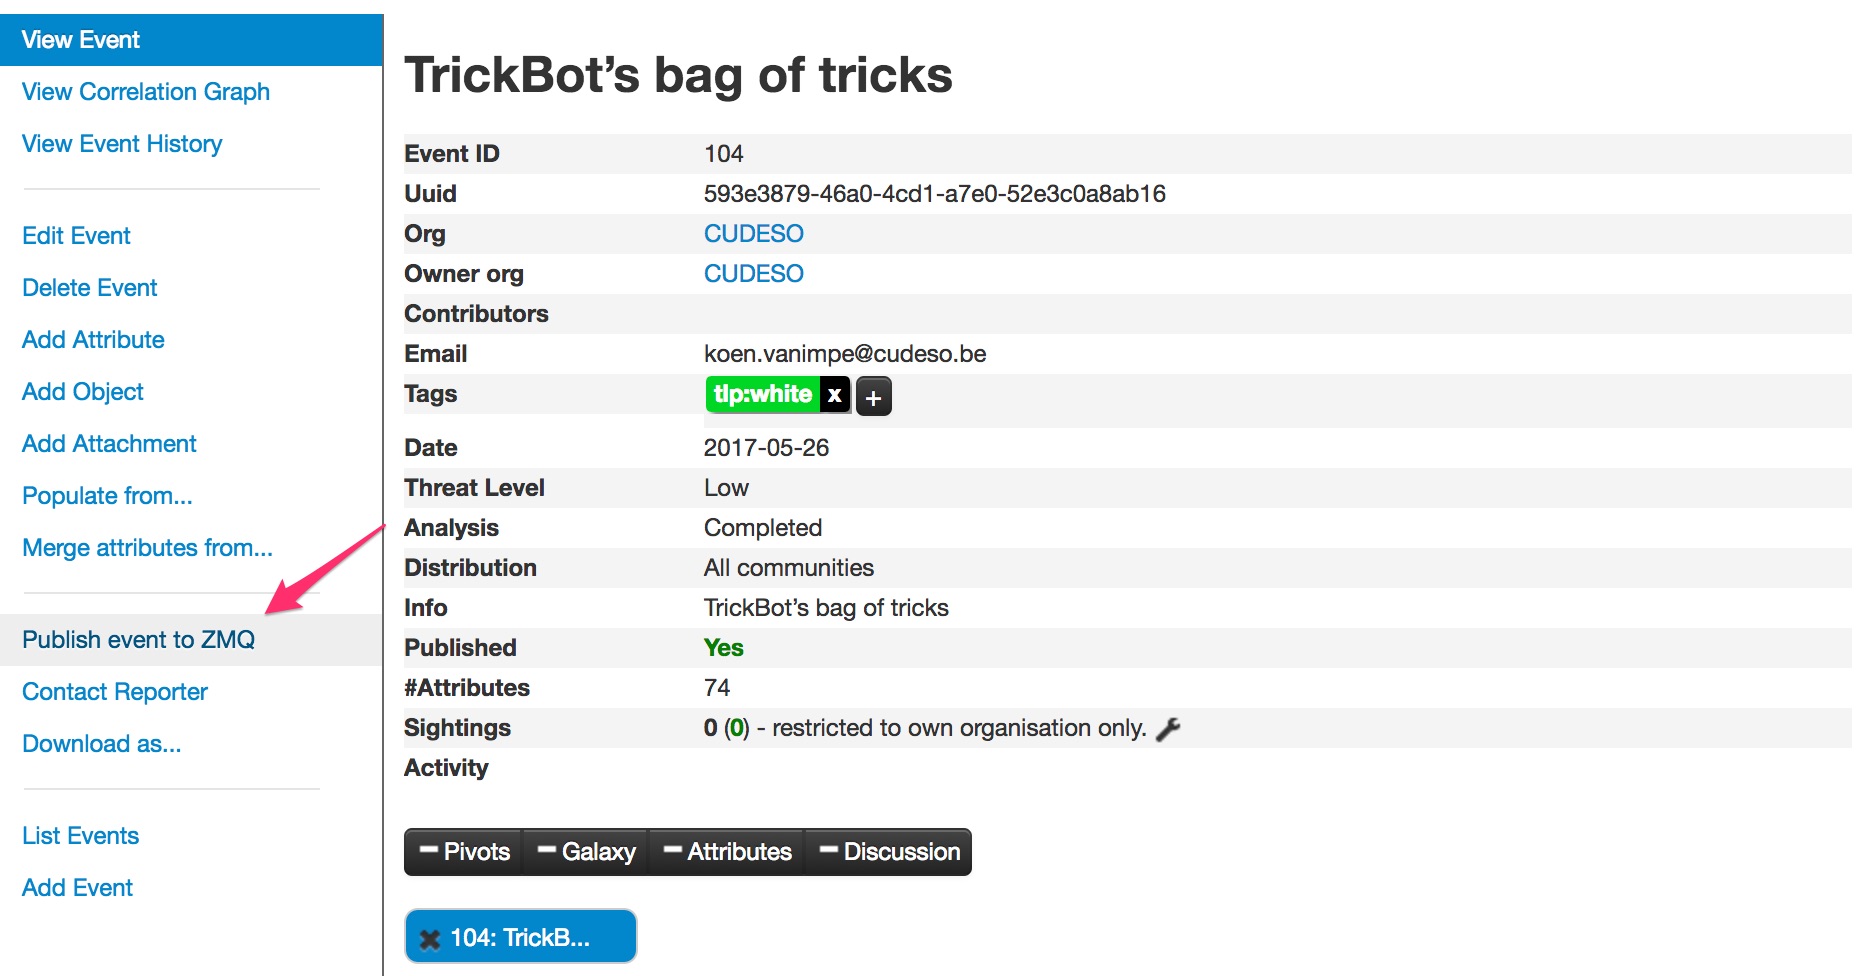
Publish events to ZMQ
Publishing events to ZMQ is easy. Open the event and in the left menu choose Publish event to ZMQ


Hi,
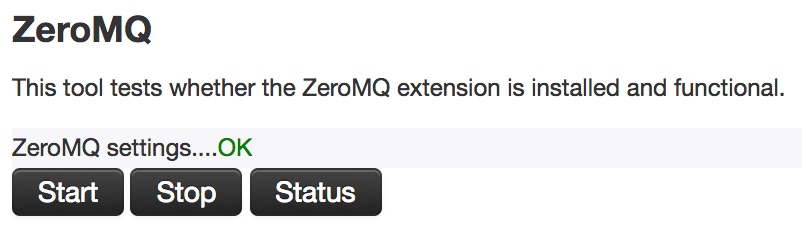
Thanks for the write up. I get stuck at the ZMQ server, I get this in diagnostics “ZeroMQ settings….ZeroMQ script not running.”
– Have you checked that the workers are running (running, have proper www-data permissions)?
– Also have a look at the type of error you’re getting in the MISP logs (tmp/Logs)
For some reason i keep getting stuck with the dashboard. Between ZeroMQ script not running and The ZeroMQ server is unreachable. Double checked install, verified the location and still hitting the error. Probably something easy i’m missing but not sure at this point.
Maybe a permission problem or another service already running on the same port?
Best advice is to open a new issue at https://github.com/MISP/MISP/issues and giving some log output (MISP logs etc.)
Can you take a look at a couple of my issues:
https://github.com/MISP/misp-dashboard/issues/120
https://github.com/MISP/misp-dashboard/issues/119
How did you manage to start the misp-dashboard scripts automatically as using VirtualEnv within crontab fails as cannot pass VirtualEnv commands into bash shell:
echo ‘source /usr/local/src/misp-dashboard/DASHENV/bin/activate; /usr/local/src/misp-dashboard/DASHENV/bin/python /usr/local/src/misp-dashboard/server.py’ | /bin/bash
Latest update of misp-dashboard has 3 scripts now to activate:
server.py
zmq_subscriber.py
zmq-dispatcher.py
How do I configure to allow remote access to the dashboard via my local browser
Please reply to my email below.
Douglas.molina@va.gov
Please how can I proceed to have the MAP display on the dashboard. Everything is working fine except the MAP that is not showing
I’m able to publish events to ZMQ but am unable to see anything on the maps, for example:
https://user-images.githubusercontent.com/8979838/213183304-4283cf2a-a4a9-4020-abda-49e484101729.png
What can I do to troubleshoot this?
Hello I am currently facing the same problem. Have you found the solution if so can you share it?