MISP and Elastic
In this post I go through the process of representing threat data from MISP in Elastic. The goal is to push attributes from MISP to Elastic and have a representation with a couple of pretty graphs. This is an alternative approach to using the MISP dashboard (and MISP-Dashboard, real-time visualization of MISP events).
Filebeat MISP
The Filebeat component of Elastic contains a MISP module. This module queries the MISP REST API for recently published event and attribute data and then stores the result in Elastic. Unfortunately it still has some sharp edges.
TL;DR : Representing MISP data in Elastic with the Filebeat module (via Docker) “kinda” works, but is not ready for production.
Workflow
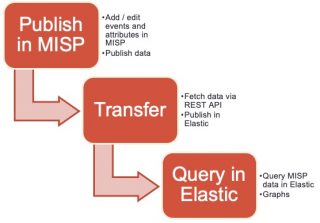
Elastic and Filebeat
I used my Elastic dfir cluster setup to get an Elastic stack up-and-running and then started Filebeat from a Docker container. After starting the container I setup the build-in dashboard and vizualisations of the Filebeat plugins. The exact process is described in the text file filebeat-dfir.txt and in the article Analyse Linux (syslog, auditd, …) logs with Elastic. You need to change the Filebeat MISP configuration by adding the API key and setting the correct url.
filebeat.config.modules:
  enabled: true
  path: /modules.d/*.yml

filebeat.modules:
- module: misp
  threat:
    enabled: true
    # API key to access MISP
    var.api_key: ""

    # Array object in MISP response
    var.json_objects_array: "response.Attribute"

    # URL of the MISP REST API
    var.url: "https://misp/attributes/restSearch/last:15m"
    var.http_client_timeout: 60s
    var.interval: 15m
    var.ssl: |-
      {
        verification_mode: none
      }
output.elasticsearch:
  hosts: ["elasticdfir01:9200"]

setup.kibana:
  host: "kibana:5601"
Under the hood the MISP Filebeat module uses the httpjson fetcher of Filebeat.
Once you started the Filebeat container it is also useful to monitor the Filebeat logs. If you spot the below error then something between the container and MISP is wrong, either on a network level or the MISP server can be under a heavy load. Note that the container will not recover, or restart the process automatically. You’ll have to do this manually.
[httpjson] httpjson/input.go:145 failed to execute http client.Do: Get "https://misp/attributes/restSearch/last:1d": GET https://misp/attributes/restSearch/last:1d giving up after 6 attempts
Frequency to query the data
As you can see in the configuration file, the data changed in the last 15 minutes (last:15m) is fetched every 15 minutes (var.interval). So why not fetch the data for the last day (last:1d) with an hourly interval (var.interval)? If you do this, then the returned data will be stored multiple times in the Elastic database. Yes, all the data returned from the REST API query is stored in Elastic. Needless to say that this duplication of data makes the approach via Elastic less useful.
There are two options to solve this, either delete the index first and then fetch all data again (for example with a daily interval) or align the interval timeframe with the timeframe for which you want to receive ‘updated’ data. I choose for the latter. The Elastic developers are aware of this issue, as described in the latest pull request to move from UUID to using the fingerprint processor on the ID field.
KQL and rule IDs
One of the interesting addition is that the Filebeat module immediately adds a KQL query based on the indicator data.
The MISP event IDs are added as the rule.id and rule.uuid.
Unfortunately these fields are not added as a hyperlink to MISP. This is something that you can achieve by using the string rewriting concept of Kibana, as described in Report sightings from Kibana to MISP.
Field conversions
The detailed field conversions from MISP to Elastic are covered in the Filebeat MISP pipeline. According to this file, it should also copy tag names from MISP event to tags field. In the Docker version of Filebeat (docker.elastic.co/beats/filebeat:7.9.2) this conversion was not included.
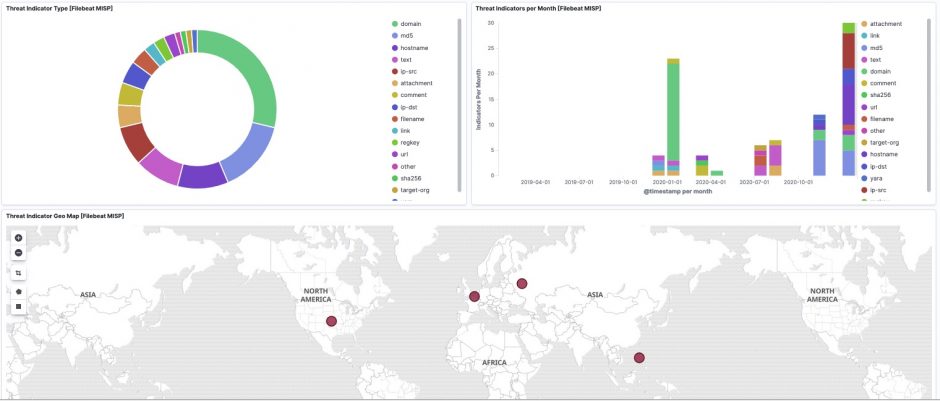
Kibana dashboard
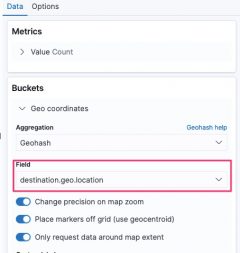
The Kibana map visualisation Threat Indicator Geo Map [Filebeat MISP] from the Filebeat module does not correctly set the field for the geo location. By default it is set to source.geo.location but you need to change this to destination.geo.location.
Conclusion
Making available the MISP data via Elastic is a good alternative to grant (junior) SOC analysts access to threat data, without introducing some of the complexities of the MISP interface. Unfortunatley you loose some of the advantages such as correlation, context and galaxy/cluster relations.
This approach is not a replacement for using MISP for enriching (or querying) data in Elastic, it’s just an extra way of disseminating data to a larger audience.
The Filebeat module for MISP still requires some extra work, so go ahead and contribute to the code!


Many thanks for the article, may i ask a question?
This Threat Intel Module needs to be enabled on the elastic-agents or on the elastic hosts themselves? I am a little confused here. Thanks!