Postfix with client authentication

Postfix and SASL

For a new project I had to foresee an SMTP relay server that supported client authentication. I love the simplicity of Postfix but setting it up with client authentication required more than just ‘a push of a button’. Below are some -unstructured- notes on how to achieve this.

The client authentication in Postfix is handled by Cyrus SASL. The Simple Authentication and Security Layer or SASL is a specification that describes how authentication mechanisms can be plugged into an application protocol on the wire. You can instruct SASL to authenticate against LDAP and MySQL but also against PAM. That’s what I used for my setup.

The default configuration file for the SASL daemon on Ubuntu is in /etc/default/saslauthd. Change these settings

START=yes
MECHANISMS="pam"
OPTIONS="-c -m /var/spool/postfix/var/run/saslauthd"

Then plug SASL authentication into the SMTP daemon. Add the file /etc/postfix/sasl/smtpd.conf

pwcheck_method: saslauthd
mech_list: plain login CRAM-MD5 DIGEST-MD5

Update the Postfix master file /etc/postfix/master.cf. Note that this does not start the smtps in the Postfix chroot.

smtps     inet  n       -       n       -       -       smtpd -v
  -o syslog_name=postfix/smtps
  -o smtpd_tls_wrappermode=yes
  -o smtpd_sasl_auth_enable=yes
  -o smtpd_recipient_restrictions=permit_sasl_authenticated,reject

… and the Postfix main file /etc/postfix/main.cf

smtpd_tls_auth_only = no
smtp_use_tls = yes
smtpd_use_tls = yes
smtpd_sasl_auth_enable = yes
smtp_sasl_mechanism_filter = !gssapi, !login, static:all
smtpd_sasl_security_options = noanonymous
smtpd_sasl_tls_security_options = noanonymous
smtpd_sasl_type = cyrus
smtpd_sasl_path = smtpd

The next step is to add the user postfix to the group sasl. Do this by editing the groups with

vigr
vigr -s

And finally restart the services.

systemctl restart postfix
systemctl restart saslauthd

Test SMTP authentication via Telnet

You can test your setup via Telnet. Note that Postfix will ask you for the username and password in base64 format (actually, also the question “username:” is in base64. Convert your username and password to base64 with

echo -en 'username' | base64

Below I authenticate with the username “username” (dXNlcm5hbWU= in base64) and “password” (cGFzc3dvcmQ= in base64).

telnet localhost 25
220 mail ESMTP Postfix
AUTH LOGIN
334 VXNlcm5hbWU6
dXNlcm5hbWU=
334 UGFzc3dvcmQ6
cGFzc3dvcmQ=
235 2.7.0 Authentication successful
Health Care Ransomware Strains Have Hospitals in the Crosshairs

I published an article on the IBM Security Intelligence blog : Health Care Ransomware Strains Have Hospitals in the Crosshairs. This article covers ways on how hospitals and other facilities can against health care ransomware attacks. Two strains stand out in recent health care ransomware attacks: Ryuk and REvil. Although they are distinct when it comes to details, they also have some common elements.

Read more Health Care Ransomware Strains Have Hospitals in the Crosshairs

Debugging MISP event publish workflow. And a faulty application gateway

For a recent MISP installation I had to debug the reason why certain events were not pushed to a remote server. First a bit of context

  • Both servers run the same version of MISP (a fairly recent version);
  • Events are pushed from server A to server B. The synchronisation user used on server A existed on server B and had sufficient permissions;
  • The server synchronisation was configured to push events if they were considered complete by the analyst. This is indicated by the workflow tag “state:complete”;
  • Server A is on one network, whereas server B is on another external network;
  • For testing purposes, we set the distribution level of our test even to ‘All communities’ (basically everybody).

Although MISP has a debug option (site_admin_debug) which can even give you SQL output, it does not contain debug information describing why a synchronisation action failed.

To debug my problem I had to use the advanced debugger options such as echo and var_dump, along with viewing the logs. Notice that I wrap these debug statement with comments so I can easily find them back afterwards (<= highly advised to do this if you've added a lot of debug statements).

Open one console where you tail the MISP error and work logs. I usually do this with

tail -f /var/www/MISP/app/tmp/logs/*

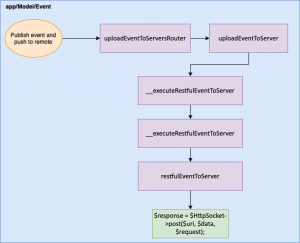
Next is adding our debug statements. There are various places where synchronisation can fail and it helps to understand the flow of how MISP publishes and pushes an event. For this session, we need to have a look in the Event Model, which you can find in app/Model/Event.php.

Pushing events after publishing is done in the function uploadEventToServersRouter

    public function uploadEventToServersRouter($id, $passAlong = null, $scope = 'events')

This function contains a foreach loop that checks every configured server. There are some additional verification steps but eventually it will upload the event with

$thisUploaded = $this->uploadEventToServer($event, $server, $HttpSocket, $scope);

This means we now have to look into the function uploadEventToServer.

public function uploadEventToServer($event, $server, $HttpSocket = null, $scope = 'events')

There you’ll find a call to execute the REST call (__executeRestfulEventToServer). Before you jump to this function, now is a good time to insert our first debug statement. If the code makes it to here, you already know that a failed synchronisation is not directly linked to the event metadata.

// DEBUG START
echo "Just before __executeRestfulEventToServer";
// DEBUG END
$result = $this->__executeRestfulEventToServer($event, $server, null, $newLocation, $newTextBody, $HttpSocket, $scope);
// DEBUG START
var_dump($result);
// DEBUG END

When I then edited the test event and published it, it returned this error message in the logs.


This made no sense at all as the event distribution level was set to ‘All communities’. Time to dive deeper and explore what’s in __executeRestfulEventToServer.

The first line of this function points us to yet another function: restfulEventToServer

$result = $this->restfulEventToServer($event, $server, $resourceId, $newLocation, $newTextBody, $HttpSocket, $scope);

The last two lines of this function are of importance. They create an HTTP socket and then the result from that HTTP socket is further parsed. This is our next opportunity to insert a debug statement.

// DEBUG START
echo "Before creating HTTP socket";
// DEBUG END
$response = $HttpSocket->post($uri, $data, $request);
// DEBUG START
var_dump($response);
// DEBUG END
return $this->__handleRestfulEventToServerResponse($response, $newLocation, $newTextBody);

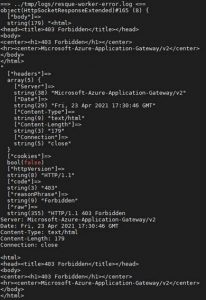
The debug message in the logs was a bit of a surprise though …


The POST request part of the MISP synchronisation was being blocked by an application gateway! Because at the time of this debug-session the administrators of the application gateway were not available I can only assume that one of the verification rules is faulty.

This is the complete journey of this debug session:


Combating Sleeper Threats With MTTD

I published an article on the IBM Security Intelligence blog : Combating Sleeper Threats With MTTD. The article covers mean time to detect (MTTD) and mean time to response (MTTR).

I cover some of the options available to reduce the MTTD, what elements can be used to define baselines and how to improve security monitoring and maturity by improving the MTTD.

Interactive usage of MISP

MISP API

The MISP API provides an easy way for interacting with MISP. In most cases you’ll do this via scripting or from external applications. Sometimes it can however be interesting to use the API to do some simple queries via Python on your threat data.

First start Python from the virtual environment.

/var/www/MISP/venv/bin/python3

Then load the libraries and set some variables.

import urllib3
from pymisp import ExpandedPyMISP, MISPObject, MISPEvent, MISPAttribute, MISPOrganisation, MISPServer
urllib3.disable_warnings(urllib3.exceptions.InsecureRequestWarning)
misp_verifycert = False
misp_url = "https://MISP/"
misp_key = "APIKEY"
misp = ExpandedPyMISP(misp_url, misp_key, misp_verifycert, proxies=None)

Now you can use the misp variable to interact with MISP.

For example to search for events

resp = misp.search(tags="tlp:white", pythonify=True)
for event in resp:
   print(event.info)

As you can see, the search is for events with tag tlp:white and we asked to have Python objects returned. This then allows us to ask for one of the properties (such as ‘info’, the event title). If you expect a large list, you can supply the parameter “limit=5” to limit the results to only 5 events.

There are other things that you can do with that same result set such as adding a tag and publishing the event.

resp = misp.search(tags="tlp:white", limit = 10, pythonify=True)
for event in resp:
   misp.tag(event.uuid,'source:EXTERNAL')
   misp.publish(event.uuid)

Obviously it’s also possible to add attributes.

uuid="7aaf7517-cd35-49c0-83bd-010900c41a06"
event = misp.get_event(uuid,pythonify=True)
a = MISPAttribute()
a.category="Network activity"
a.type="ip-dst"
a.value="8.8.4.4"
print(misp.add_attribute(event,a))

Staying in control of MISP correlations

MISP correlations

MISP correlations are a way to find relationships between attributes and indicators from malware or attacks campaigns. Correlation support analysts in detecting clusters of similar activities and pivot from one event to another.

When the volume of data in your MISP instance grows, the number of correlations can however explode and make your system less responsive. I cover some approaches that you can use to stay in control.

What is correlation?

Correlation basically is a way for MISP to indicate that a certain value exists in more than one event. Typical examples include the same IP address observed during different attack campaigns or the same domain used by various phishing attacks. The correlation feature of MISP is not limited to basic technical indicators, you can also use it to correlate on for example (the same) YARA rule.

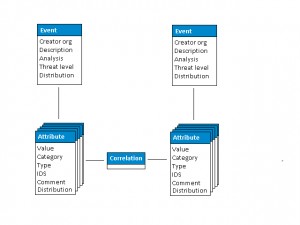
Data model

The correlation takes place on attribute level. But because attributes are enclosed in an event, they are also represented on event level.

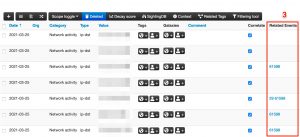
There are in fact three ways how MISP informs you of correlations:

  1. On the event index;
  2. In the event detail page;
  3. Next to the attributes that cause the correlation.


Options for disabling correlation

Reasons for disabling correlation

Some of the reasons why you would choose to disable correlation include

  • The correlation is on attributes that have no real value for your organisation;
  • The value is not very specific. An example is correlating on a destination port. Correlating on tcp/80 or tcp/443 is maybe not that useful, whereas correlating on a high network port (above 1024) can be useful;
  • Your system has not sufficient resources to cope with all the correlations.

Per attribute

Correlation in MISP is done in the background and doesn’t require additional effort from an analyst.

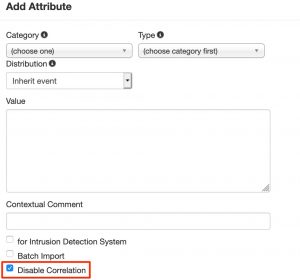
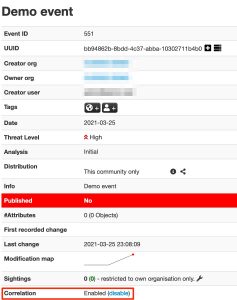
That said, you can still prevent correlation from taking place. When you add attributes, either manually, in batch or via the freetext import you always have the choice to override the automatic correlation by checking Disable Correlation.

Important to realise is that disabling the correlation on attribute level only disables the correlation for the specific attribute you’re adding/editing. It does not disable the MISP correlation engine for other attributes or other events.

Per event

Instead of disabling correlation per attribute, you can also disable correlation on event level. By enabling MISP.allow_disabling_correlation you give event creators the option to disable all correlations for a specific event.

Exclude values for correlation

You can exclude correlation from taking place on specific values with correlation exclusion entries. Under Input Filters > List Correlation Exclusions you can add a list of attribute values for which you want no correlation to take place.

As you can notice, you can also cleanup the already existing correlations.

Completely disable correlation

You can disable the correlation index of MISP completely by enabling MISP.completely_disable_correlation. Enabling this setting will trigger a full recorrelation of all data which is an extremely long and costly procedure.

Only enable this if you know what you’re doing.

Correlation, performance and resources

Performance tuning

In some cases your system might have sufficient resources to cope with correlation but you still experience slowness when logging in. This is most likely because you are displaying the number of correlations on the event index page. Correlations aren’t cached, this means that they are requested (counted) every time when accessing the event index page. You can get a huge performance increase on the event index page by disabling MISP.showCorrelationsOnIndex.

This does not disable correlation. It just prevents correlations from being displayed on the event index page. You still have access to all correlations on the event details page and in the list of attributes.

“overhead” statistics

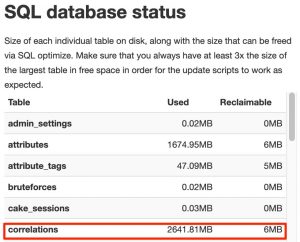
MISP helps you in diagnosing some of the resource issues related to correlation. Under Server Settings & Maintenance > Diagnostics you can use the SQL database status to get an overview of the volume of correlations and how much drive space is reclaimable. Reclaiming this drive space can give your server some extra (storage) breathing room.

The fact that you can “reclaim” drive space is the result of database manipulations taking place when adding, editing and deleting data.

MISP does not include tools to reclaim the drive space via its administration interface. You need to use the mysql administration tool for this. Once you are logged in into mysql, use the command optimize table correlations.

MariaDB [misp]> optimize table correlations;
+-----------------+----------+----------+-------------------------------------------------------------------+
| Table           | Op       | Msg_type | Msg_text                                                          |
+-----------------+----------+----------+-------------------------------------------------------------------+
| misp.correlations | optimize | note     | Table does not support optimize, doing recreate + analyze instead |
| misp.correlations | optimize | status   | OK                                                                |
+-----------------+----------+----------+-------------------------------------------------------------------+
2 rows in set (3 min 42.36 sec)

Important to note is that in order to reclaim space, you first need to have sufficient space (at least the size of the table) available to start the reclaiming. If there’s not sufficient space, you’ll get an error (the error message isn’t that informative).

MariaDB [misp]> optimize table correlations;
+-------------------+----------+----------+-------------------------------------------------------------------+
| Table             | Op       | Msg_type | Msg_text                                                          |
+-------------------+----------+----------+-------------------------------------------------------------------+
| misp.correlations | optimize | note     | Table does not support optimize, doing recreate + analyze instead |
| misp.correlations | optimize | error    | Incorrect key file for table 'correlations'; try to repair it     |
| misp.correlations | optimize | status   | Operation failed                                                  |
+-------------------+----------+----------+-------------------------------------------------------------------+
3 rows in set, 1 warning (1 min 13.59 sec)

Conclusions

MISP correlations provide an excellent way to pivot between different threat events. It can however be challenging to cope with the required system resources. It’s highly advised not to disable the correlation engine, but to exclude certain low values from correlation and run the SQL-optimize commands on a regular basis.

Creating a MISP Object, 101

MISP Objects

I published an article on the blog of the MISP project on how to create your own custom object: Creating a MISP Object, 101. This is a follow-up to a previous post on how to create your own MISP galaxy or MISP cluster (Creating a MISP Galaxy, 101).

Cyber Resilience Strategy Changes You Should Know in the EU’s Digital Decade

I published an article on the IBM Security Intelligence blog : Cyber Resilience Strategy Changes You Should Know in the EU’s Digital Decade. The article describes the new EU Cybersecurity Strategy and one the proposal for a revised Directive on Security of Network and Information Systems

The EU Commission attempts to improve cyber resilience with the NIS2 Directive and provides an overview of cyber resilience challenges for 5G and IoT. Other topics discussed include the Cybersecurity Industrial, Technology and Research Competence Centre and Network of Coordination Centres (CCCN), a European Cyber Shield, the Joint Cyber Unit and where Diplomacy and Defense Meet Cyber Crime.

Use Elastic to represent MISP threat data

MISP and Elastic

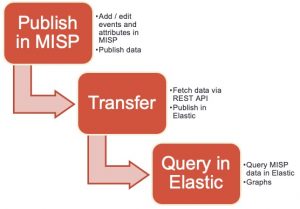
In this post I go through the process of representing threat data from MISP in Elastic. The goal is to push attributes from MISP to Elastic and have a representation with a couple of pretty graphs. This is an alternative approach to using the MISP dashboard (and MISP-Dashboard, real-time visualization of MISP events).

Filebeat MISP

The Filebeat component of Elastic contains a MISP module. This module queries the MISP REST API for recently published event and attribute data and then stores the result in Elastic. Unfortunately it still has some sharp edges.

TL;DR : Representing MISP data in Elastic with the Filebeat module (via Docker) “kinda” works, but is not ready for production.


Workflow


Elastic and Filebeat

I used my Elastic dfir cluster setup to get an Elastic stack up-and-running and then started Filebeat from a Docker container. After starting the container I setup the build-in dashboard and vizualisations of the Filebeat plugins. The exact process is described in the text file filebeat-dfir.txt and in the article Analyse Linux (syslog, auditd, …) logs with Elastic. You need to change the Filebeat MISP configuration by adding the API key and setting the correct url.

filebeat.config.modules:
  enabled: true
  path: /modules.d/*.yml

filebeat.modules:
- module: misp
  threat:
    enabled: true
    # API key to access MISP
    var.api_key: ""

    # Array object in MISP response
    var.json_objects_array: "response.Attribute"

    # URL of the MISP REST API
    var.url: "https://misp/attributes/restSearch/last:15m"
    var.http_client_timeout: 60s
    var.interval: 15m
    var.ssl: |-
      {
        verification_mode: none
      }
output.elasticsearch:
  hosts: ["elasticdfir01:9200"]

setup.kibana:
  host: "kibana:5601"

Under the hood the MISP Filebeat module uses the httpjson fetcher of Filebeat.

Once you started the Filebeat container it is also useful to monitor the Filebeat logs. If you spot the below error then something between the container and MISP is wrong, either on a network level or the MISP server can be under a heavy load. Note that the container will not recover, or restart the process automatically. You’ll have to do this manually.

[httpjson]	httpjson/input.go:145	failed to execute http client.Do: Get "https://misp/attributes/restSearch/last:1d": GET https://misp/attributes/restSearch/last:1d giving up after 6 attempts

Frequency to query the data

As you can see in the configuration file, the data changed in the last 15 minutes (last:15m) is fetched every 15 minutes (var.interval). So why not fetch the data for the last day (last:1d) with an hourly interval (var.interval)? If you do this, then the returned data will be stored multiple times in the Elastic database. Yes, all the data returned from the REST API query is stored in Elastic. Needless to say that this duplication of data makes the approach via Elastic less useful.

There are two options to solve this, either delete the index first and then fetch all data again (for example with a daily interval) or align the interval timeframe with the timeframe for which you want to receive ‘updated’ data. I choose for the latter. The Elastic developers are aware of this issue, as described in the latest pull request to move from UUID to using the fingerprint processor on the ID field.

KQL and rule IDs

One of the interesting addition is that the Filebeat module immediately adds a KQL query based on the indicator data.


The MISP event IDs are added as the rule.id and rule.uuid.

Unfortunately these fields are not added as a hyperlink to MISP. This is something that you can achieve by using the string rewriting concept of Kibana, as described in Report sightings from Kibana to MISP.

Field conversions

The detailed field conversions from MISP to Elastic are covered in the Filebeat MISP pipeline. According to this file, it should also copy tag names from MISP event to tags field. In the Docker version of Filebeat (docker.elastic.co/beats/filebeat:7.9.2) this conversion was not included.

Kibana dashboard

The Kibana map visualisation Threat Indicator Geo Map [Filebeat MISP] from the Filebeat module does not correctly set the field for the geo location. By default it is set to source.geo.location but you need to change this to destination.geo.location.


Conclusion

Making available the MISP data via Elastic is a good alternative to grant (junior) SOC analysts access to threat data, without introducing some of the complexities of the MISP interface. Unfortunatley you loose some of the advantages such as correlation, context and galaxy/cluster relations.

This approach is not a replacement for using MISP for enriching (or querying) data in Elastic, it’s just an extra way of disseminating data to a larger audience.

The Filebeat module for MISP still requires some extra work, so go ahead and contribute to the code!

Cybersecurity Ethics: Establishing a Code for Your SOC

I published an article on the IBM Security Intelligence blog : Cybersecurity Ethics: Establishing a Code for Your SOC. The article describes the dilemmas you can face when working in a SOC or doing incident response work.

The articles describes Cybersecurity Ethics Guidance Frameworks, Best Practices and a Practical Approach for Cybersecurity Ethics, including a set of commandments to adhere. For example

  • Do not use a computer to harm other people.
  • Protect society and the common good.