IOC / APT scanner
An antivirus solution is an indispensable component in your defence arsenal but it does not protect you against all threats. Complimentary to an antivirus is Loki, an open-source IOC scanner. Loki is a scanner that allows you to search for intrusion activity such as
- Network connections to C2 servers or malicious domains;
- Presence of files related to APT activity;
- Process anomalies such as malicious implants or patches in memory ;
- Credential dump activities;
- Checks for Reginfs (Regin malware) or DoublePulsar.
The most common use case is a “Triage” or “APT Scan” scenario in which you scan all your machines to identify threats that haven’t been detected by common antivirus solutions. What makes Loki different to common antivirus solutions is that you can provide it your own set of detection rules. Why is this important? Organisations such as ICS CERT, Kaspersky ICS CERT and ESET publish on regular basis detection rules. In addition to this, if you are part of a threat sharing group (fe. see MISP communities) you receive frequent updates on the new threats targeting your sector. You can leverage this information with Loki to hunt for malicious activity. Loki supports
- File hashes (MD5, SHA1, SHA256);
- Hard and soft indicator filenames based on regular expressions;
- C2 IOCs in the form of IP addresses and domain names;
- YARA rules.
YARA rules are a flexible way to detect various types of -malicious- activity by combining detection elements with some logic.
Use case
My use case was
- Collect threat information for specific sectors;
- Use this information to create detection rules for specific target environments;
- Make these rules available for Loki and have Loki scan the systems;
- Collect and process the logs and make the results accessible in a dashboard.
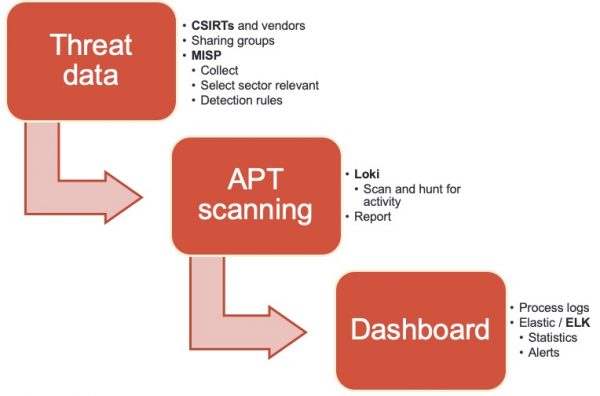
Get the threat data!
The easiest way to collect threat data is by setting up MISP, an Open Source Threat Intelligence Platform and connecting your instance with those of CSIRTs, vendors and threat sharing groups. The next step is to extract the data from MISP and make it available in a format that can be used by Loki. The signatures of Loki are provided via a separate Github repository, which also allows contains tooling to fetch threat data from MISP. Unfortunately, the connector was outdated and didn’t support MISP warning lists (lists of well-known indicators that can be associated to potential false positives, errors or mistakes) or selection of threat data based on a taxonomy (fe. via MISP tagging). I submitted a pull request with a new version of get-misp-iocs.py.
Using the threat connector is easy
/var/www/MISP/venv/bin/python3 ./get-misp-iocs.py -t '["PAP:GREEN", "Target:CIIP", "Target:ICS"]' -w 1
The above command collects threat data and writes these in the files iocs/misp-<item>-iocs.txt
- Classified with PAP:Green (Permissible Actions Protocol) and target sectors CIIP or ICS;
- And make sure that most likely false positives are removed.
When all is done, your set of custom detection rules will be available in the folder IOCS.
Client scanning with Loki
Loki does not require an installation and can be run directly from the command line. You do need to take some preparatory actions.
- Extract the latest release of Loki on a trusted system;
- Run loki-upgrader;
- Copy the folder with IOCS collected in the previous step to the folder signature-base/iocs;
- Make the folder loki available to the other systems. For isolated environments it’s best to copy them to individual USB drives (one drive per system).
Loki requires administrator privileges to execute properly. A full system scan can take quite a while (on moderate systems, easily up to an hour).
loki.exe --reginfs --pesieveshellc
This will start Loki and have it scan for APT threat data based on your detection rules. In addition to this it will also scan for the presence of the Regin file system and attempt to detect shell code (memory regions that are not a part of any module, but contain executable code). Loki stores its output in a text log file in the directory where it was executed (you can change this with the option –logfolder). Loki also supports export to CSV (option –csv) but for the further process I’ll use the default log format.
Loki logs dashboard
Once Loki has finished scanning and you have collected the individual log files you can process and present them in an easy accessible format. I use the Elastic stack and rely on a previous project for analysing Linux logs : a setup of an Elastic DFIR cluster.
The cluster configuration contains an updated Logstash configuration file to process Loki log files and a patterns file for the timestamp. The docker-compose file is also changed to make the patterns directory available for the Logstash docker containers.
Importing the log files can be done by first copying the log files in the directory logs and then by running Filebeat from the ~/elastic-dfir-cluster directory.
docker run -d --net=elastic-dfir-cluster_elastic --name=filebeat --volume="$(pwd)/filebeat/filebeat.docker.yml:/usr/share/filebeat/filebeat.yml:ro" --volume="$(pwd)/logs:/volume/:ro" -e -strict.perms=false docker.elastic.co/beats/filebeat:7.9.2 filebeat
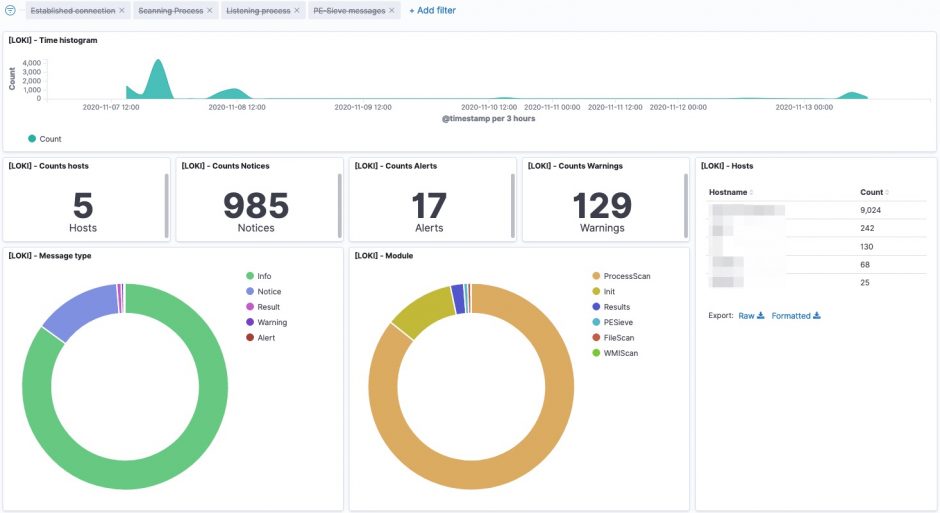
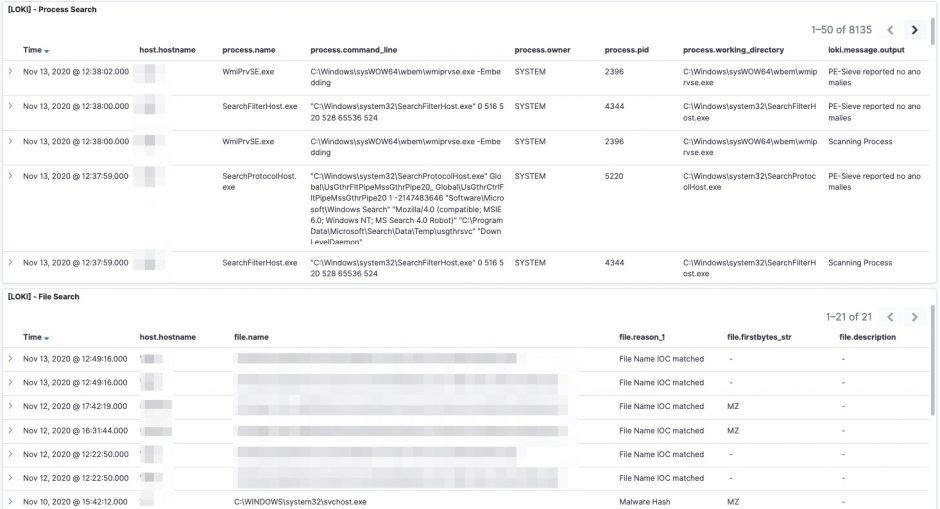
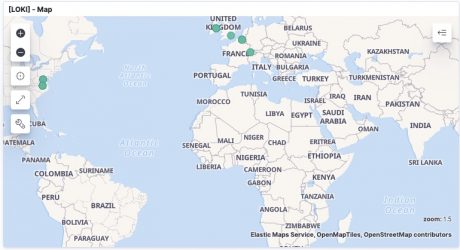
The logs are available in Kibana once Logstash has finished processing them all. I created a number of dashboards and visualisations that you can use as inspiration to set up your own dashboards. One of the extra outcomes of this approach is that the processing of the Loki log files gives you a detailed view on
- The running processes on each system;
- The active and listening network connections on each system.
UPDATE 20201114: I added an export of the Kibana dashboard in the Github repository. You can import this dashboard directly to get visualisations as the ones below.
curl -X POST "<hostname>:5601/api/kibana/dashboards/import" -H 'kbn-xsrf: true' -H 'Content-Type: application/json' -d'
... paste here everything from loki-dashboard.json
'
EDR
Some of the features from Loki are also available via EDR tools to detect and respond to security incidents. However not all organisations have an EDR tools and they are certainly very rare in isolated (not connected to the Internet) environments.


Hello Koen.
Nice article. You could probably achieve the same result by replacing Loki by Bro in your toolset but of course with the disadvantage to be forced to install it.
By the way, I envy you to still have time to write articles 😉
Hi Dimitri,
Thank you for the feedback.
Indeed, Bro is a good alternative. Also received the suggestion to check out Thor Lite (https://www.nextron-systems.com/thor-lite/), looks interesting!
Hi Koen!
Thanks for a great article!
The link to the “updated Logstash configuration file” doesnt work. Do you know where I can find that file?
Thanks.
BR Jorgen
Hello Jorgen,
The file is located at “https://github.com/cudeso/elastic-dfir-cluster/blob/main/logstash/pipeline_configfiles/default-loki.conf”. Thank you for pointing out the wrong link. I updated the article.