Use Philips Hue as an IDS

Philips Hue

I recently bought a Philips Hue light system. It allows you to control your lights via a smartphone app and set the right colour mood. Setup is easy, you connect a light bridge to your home router, connect with the app and then setup the lights. The system also includes an API to build your own apps.

Use Snort to detect malicious code

In 2015 I tweeted on an episode of CSI Cyber where “good” code automagically turned green whereas “bad” code turned up red : Critical @Snort IDS rule update according to #CSICyber.


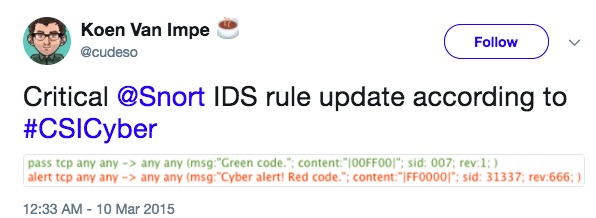
So why not use the Philips Hue system to mimic this environment?

Workflow

The workflow I came up with is Snort > Syslog > External app > Philips Hue


Custom ruleset for Snort

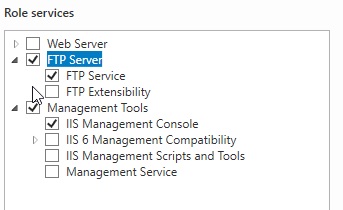
The first part to configure is setting up Snort. This is easy with Ubuntu

apt-get install snort

For my experiment I only needed two rules. I disabled all other IDS rules in the snort config file (/etc/snort/snort.conf) and included my own ruleset. In snort.conf :

include $RULE_PATH/cudeso.rules

And then the actual rules :

alert tcp any any -> any any (msg:"CustomDLP : Access to mysecretfile"; content:"mysecretfile"; sid:990001; rev:6;)
alert tcp any any -> any any (msg:"CustomSafeDLP : Access to safefile"; content:"safefile"; sid:990002; rev:1;)

Basically what these rules do is alert on every connection to either “mysecretfile” or “safefile”.

Syslog logging for Snort

Snort needs to be configured to log to syslog. Do this in the config file with

output alert_syslog: LOG_AUTH LOG_ALERT

Note that snort logging to syslog on Ubuntu systems is in the file /var/log/auth.log.

Rsyslog

How do I get from Snort alerting to switching on the light bulb? Snort is able to log to syslog. In my case I use rsyslog. Rsyslog is able to execute custom applications based on certain log events.

In /etc/rsyslog.conf add these lines

module(load="omprog")
if $rawmsg contains "snort" then
   action(type="omprog"
       binary="/home/koenv/philips.py"
       template="RSYSLOG_TraditionalFileFormat")

This configuration setting will launch the script “philips.py” (in my home directory) whenever an event is found that has the string “snort”.

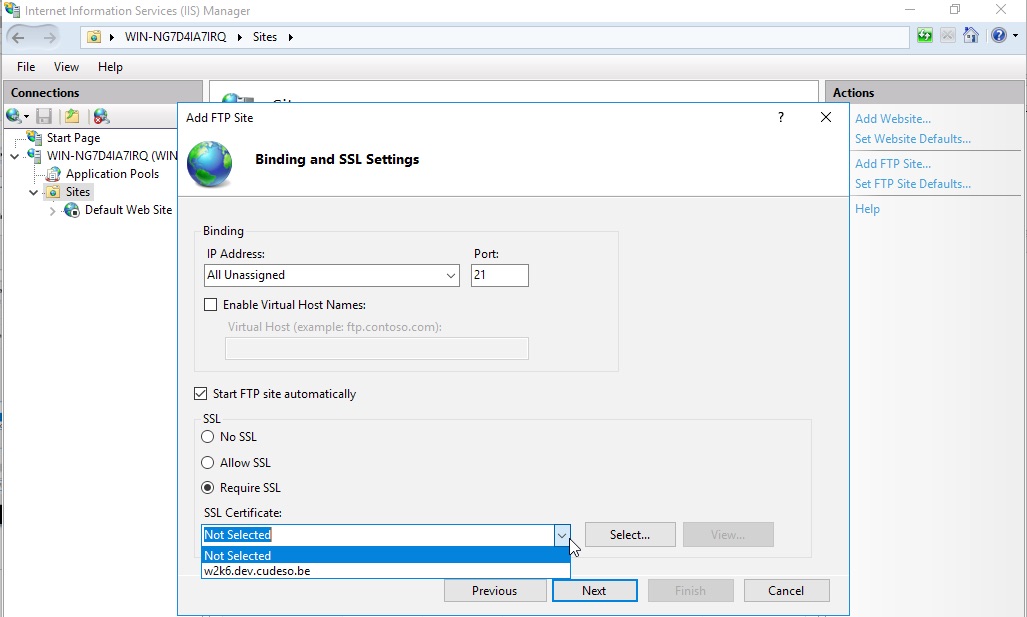
Configure your light bridge

The Philips site has a detailed explanation on how to get API access to your light system : Getting started with Philips Hue. You need to get your user ID (the authentication string, notice that this is all in HTTP) and the ID of your light bulb.

The Philips Hue script

So far we have Snort alerting on our custom rules, generating an alert in syslog and then rsyslog executing an external application.

Rsyslog has a good skeleton that describes how you should build your external custom alerting application : https://github.com/rsyslog/rsyslog/blob/master/plugins/external/skeletons/python/plugin.py.

Because this is a proof of concept I didn’t really needed the throttling in processing the messages. I used my script below

#!/usr/bin/env python
# -*- coding: utf-8 -*-

import sys
import requests
import json
import time

SYSLOG_ALERT="CustomDLP"
SYSLOG_PASS="CustomSafeDLP"
LIGHT_BRIDGE = "192.168.x.x"
LIGHT_ID=5
LIGHT_USER_ID="your-philips-hue-id"
LAMP_RED={"on": True, "xy":[0.65,0.25]}
LAMP_GREEN={"on": True, "xy":[0.1,0.8]}

def lamp_on(lampid, payload):
    url = "http://%s/api/%s/lights/%s/state" % (LIGHT_BRIDGE, LIGHT_USER_ID, lampid)
    r = requests.put(url, data=json.dumps(payload))

def lamp_off(lampid):
    url = "http://%s/api/%s/lights/%s/state" % (LIGHT_BRIDGE, LIGHT_USER_ID, lampid)
    payload = {"on":False}
    r = requests.put(url, data=json.dumps(payload))


syslogline = sys.stdin.readline()
if syslogline.count(SYSLOG_ALERT) > 0:    
    lamp_on(LIGHT_ID,LAMP_RED)
    time.sleep(2)
    lamp_off(LIGHT_ID)
elif syslogline.count(SYSLOG_PASS) > 0:    
    lamp_on(LIGHT_ID,LAMP_GREEN)
    time.sleep(2)
    lamp_off(LIGHT_ID)

The script does two things depending on the Snort alert :

  • If it contains the string “CustomDLP” (defined in SYSLOG_ALERT) it will set the light to red;
  • If it contains the string “CustomSafeDLP” (defined in SYSLOG_PASS) it will set the light to green;

Finishing the setup

Restart rsyslog and launch Snort, either via your normal startup scripts or via the command below. The -i indicates the interface Snort has to monitor.

/usr/sbin/snort -m 027 -u snort -g snort -i ens33  -c "/etc/snort/snort.conf"

Philips Hue as an IDS

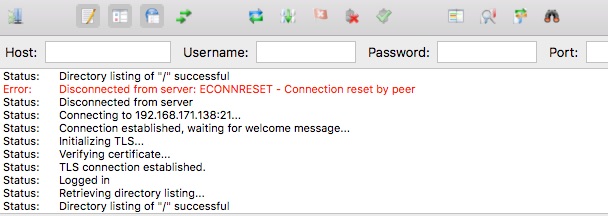
The previous commands started Snort, had it log to syslog and then have rsyslog execute an external command. Now it’s about time to test this setup. In another console try

wget www.google.com/mysecretfile

or try

wget www.google.com/safefile

Philips Hue as IDS from Koen on Vimeo.

Where to go from here?

I strongly recommend you not to switch on your light bulbs for every single IDS alert. However setting up the IDS rules for triggering on access on very specific files or requests can be useful. And even if it’s not that useful, it makes great pictures for a war-room!

Using a Free Online Malware Analysis Sandbox to Dig Into Malicious Code

I published an article on IBM Security Intelligence on Using a Free Online Malware Analysis Sandbox to Dig Into Malicious Code.

The article is a follow-up on an earlier post from 2015 (Comparing Free Online Malware Analysis Sandboxes) where I compare the features of different free online malware sandbox solutions, how you can extract indicators of compromise and how you should integrate them within your incident management workflow. The free malware sandbox solutions reviewed are VirusTotal, Malwr.com and VxStream.

Upgrading Apache, unmet dependencies

Upgrading Apache on Ubuntu 14.04.5

I use a couple of Ubuntu Linux virtual machines via VMWare Fusion (OSX) for security testing. Some of the security tools have a web interface. Because I want to test with different environment setups I have /var/www/ mounted via Shared Folders on the host OSX. This has as advantage that

  • Files are stored centrally (on the host OS)
  • Different environments can use the same files and configuration (if stored in /var/www)
  • I can use native OSX tools to manipulate and edit files

The usual apt-get update / upgrade process recently caused an error

Reading package lists... Done
Building dependency tree
Reading state information... Done
You might want to run 'apt-get -f install' to correct these.
The following packages have unmet dependencies:
 apache2 : Depends: apache2-bin (= 2.4.7-1ubuntu4.13) but 2.4.7-1ubuntu4.17 is installed
           Depends: apache2-data (= 2.4.7-1ubuntu4.13) but 2.4.7-1ubuntu4.17 is installed
E: Unmet dependencies. Try using -f.

Using the -f (fix broken) option did not solve the issue

Errors were encountered while processing:
 /var/cache/apt/archives/apache2_2.4.7-1ubuntu4.17_amd64.deb
E: Sub-process /usr/bin/dpkg returned an error code (1)

I was able to resolve the issue by unmounting the shared folder, doing the fix broken upgrade and then remounting the shared folder. I do not know what is the underlying problem but it solved the problem in my case.

Remember that mounting the shared folders is done via

mount -t vmhgfs .host:/www /var/www/

Monitor your public assets via Shodan

Monitor your assets in Shodan

Shodan is a powerful tool for doing passive reconnaissance. It’s also a great source of information that you can put to good use to monitor your publicly available assets. Shodan acts as a search engine (also see: : What is Shodan.io?), whatever that is connected to the internet will get indexed by their crawlers.

I wrote a script that takes one parameter (ideally a string) and

  • Fetches the information that is available at Shodan for your query string;
  • Stores the results in a sqlite database;
  • Whenever something news pops up (this can be either a new host or a new port on an existing host) it will alert you by e-mail;
  • Note that ports that are no longer available are not covered and the script does not monitor service banner changes.

It’s available for download at Github via https://github.com/cudeso/tools/tree/master/shodan-asset-monitor

Configure Shodan Monitor

The configuration is in the script with these settings

  • SHODAN_API_KEY : your Shodan API key
  • MAIL_SUBJECT : the subject of the alert email (the asset change gets added to the subject)
  • MAIL_FROM : the email sender
  • MAIL_RCPT : the email receiver
  • MAIL_SMTP : the mail server
  • SQL_LITE_DB : the name of the sqlite db (defaults to shodan-asset-monitor.db)
  • PRINT_PROGRESS : print status to screen when run (disable for cron-jobs)

Cron job

Ideally you run the script from a cron job, for example every day. Set the configuration option PRINT_PROGRESS to False when running from cron.

If you run the script from cron you might have to change SQL_LITE_DB to an absolute path instead of a relative path. This depends on your cron settings.

SQL_LITE_DB="/home/user/shodan-monitor/shodan-asset-monitor.db"

Shodan python library

You need the Shodan python library

sudo pip install shodan

Create sqlite database

Before you can run it you need to create the sqlite database.

sqlite3 shodan-asset-monitor.db < shodan-asset-monitor.sql

First run

Obviously, when run from the first time it will generate a lot of alerts (all hosts and ports are new). You can disable mail notifications on the first run by adding a second parameter (‘any’ parameter will do, no specific value). You can make that change permanent by setting NOTIFY_MAIL to False. This will not notify you by e-mail of changes found in Shodan.

Then run the script

./shodan-asset-monitor.py belgium.be


The output will indicate if a new asset was found or if an existing host has changed.

What is Shodan?

Somebody at $work asked me to give some more insight on Shodan, what it is and how you can put it to good use. I shared the presentation on Slideshare.

Test driving Microsoft Log Analytics

Log analytics

Centralized logging is essential during incident response. If you can only rely on local logs then you risk losing crucial information when reconstructing the timeline of a security incident. Local logs should not be trusted during an incident as they might have been altered by an intruder. Additionally centralized logging allows you to combine different log sources into one data set for investigation.

I used a couple of centralized log solutions in the past, including Splunk and ELK (Using ELK as a dashboard for honeypots) for monitoring honeypots.

Microsoft recently also jumped on the bandwagon of “centralized logging” with their Azure provided Log Analytics, part of the Operations Management Suite (OMS). And it comes with a free plan, allowing you to store data for up to 7 days. In most cases 7 days will not be enough for incident response but it’s more than enough to build a data set and evaluate the product.


Adding a Linux host to OMS

Once you signed up for OMS the first thing to do is adding a host. My honeypots run on Linux. Adding a Linux host is a matter of a few clicks in the Connected Sources tab in OMS.


Installing the Linux agent is described in detail at Connect your Linux computers to Log Analytics. It requires you to download the package and then install it.

Once you have installed the Linux agent you will need to wait a while before the agent data turns up in OMS.

Microsoft Log Analytics Search

The log search feature is quite powerful and intuitive but in essence no different than the search feature in Splunk or Kibana.


The search either gives you a list or a table view. You can select or deselect the filters by the menu on the left. The list of filters (source type, fields, …) gets updated when you drill down the data set. Additionally the Minify option gives you a summarised view of the result set.

I found this Minify option very useful to have quick overview of what type of data was most present in the result set. If you have lots of records and it’s difficult to find what’s common between the different records then this option is certainly a time saver.


You can also immediately apply conversation filters on these results and get a graph of the data


Graphs

We all want graphs because vizualisations of events is the easiest way for detecting anomalies in a large data set.

Creating graphs in OMS is a matter of point and click. And frustration. The slight syntax differences between search and graph queries are annoying and make it difficult to get quick results. Additionally OMS makes a difference between a Tile (a block that you can put on the start screen) and a View. The latter are the type of graphs you want on a dashboard. Unfortunately there’s no “create view from tile”. Adjusting the filter expression does not always immediately update the graph, this required reloading the entire page on some occassions.


Custom logs

You can add your own custom log files to OMS. A great feature is that you do not have to log in to the machine that’s running the agent and manually alter configuration files. All the changes can be done via the web interface. You’re done after uploading a log file sample, selecting the record delimiter and the log collection path. The last step can take a while before being completed.


Once completed, this will add a section to the configuration file of the agent.

<source>
  type sudo_tail
  path /home/ubuntu/parse-dionaea/cowrie/cowrie-connections.log
  pos_file /var/opt/microsoft/omsagent/state/CUSTOM_LOG_BLOB.cowrie_connections_CL__REDACTED.pos
  read_from_head true
  run_interval 30
  tag oms.blob.CustomLog.CUSTOM_LOG_BLOB.cowrie_connections_CL_REDACTED.*
  format none
</source>

Custom fields

Typically the logs gathered by honeypots aren’t in a format that’s immediately understood by the search engine. Microsoft allows you to define custom fields in log files.

The custom fields are created starting from a search query. You select one of the fields that contain the custom log data and then go to the wizard to extract data.


Once you have selected the field, the wizard will ask you for a name and propose the matches according to your previous selection. A nice thing of the wizard is that you can alter the selection and immediately see the results.


Once that you have defined the custom fields you have to wait for new data to enter. Unfortunately, the custom fields are not applied to the data that is already in the database.

Remarks

Slow or unresponsive web interface

Although the web interface for OMS looks relatively slick it’s a real pain. Sometimes it’s slow or not responding and then you can only revert to reloading the web page (and loosing the changes or queries you just made). Working with multiple tabs and seeing your changes light up in the other tabs doesn’t always work. Most of the time it required a full page reload before you can access your changes. Testing was done with the latest version of Chrome on OSX.

These malfunctions and bugs are acceptable in a “proof-of-concept” but not in a production environment. It almost feels as if Microsoft is using their users as a testbed. I don’t mind when this concerns the ‘dev’ branch of a free version but if I would be a paying customer I would be very dissatisfied with its current (Jul-17) state.

That said, there’s almost not a week that goes by when you discover that a new feature is introduced.

Search is good

If you are interested in a good search engine for analyzing your logs with manual queries then OMS is certainly a good choice. The search feature with autocomplete suggestions is definitely worth looking at.

Storing your logs with a cloud provider

Storing my honeypot logs with a cloud provider isn’t that much of a deal. But storing the logs of your crown jewels with an external provider that is still in the process of “getting things right” is maybe not the best thing to do.

Choose your targets!

I used OMS for collecting honeypot data. Although there are a couple of features that allow it to parse Linux logs it’s not a perfect solution.

I did not had the time to evaluate some of the more integrated Windows features but looking at the options presented they do look promising.


Conclusion

Would I choose the Microsoft Log Analytics solution for monitoring my honeypots? No. This product is still a “work in progress” and it takes quite some time and effort for getting the expected results.

Does it have potential? Yes. The search feature is really good and if they can iron out the flaws in the web interface and make the process of “acquire external data source > filter > graph on dashboard” more fluent it would certainly be a good competitor for Splunk or ELK. But as of this moment it isn’t.

NotPetya / ExPetr information

I updated my page on WannaCry with information on the latest NotPetya ransomware attack : https://www.wannacry.be.

Secure Windows File Copy – Secure FTP

Secure transfer of files, a central file transfer server for Windows

There are several solutions for copying files between Windows hosts, the protocol that most file transfers in the Windows world will default to is SMB (yes, thats the same protocol as used by Wannacry). What alternatives are available? The pre-requisites are

  • Audit and logging capabilities, each transfer should be logged;
  • One central server where files get pushed to and pulled from;
  • Authentication, before a file transfer can happen, the user should authenticate;
  • Secure transfer of files, meaning traffic that is not easy for attackers to eavesdrop. Although the transfers happen on an internal network precautions should be taken so that attackers can not eavesdrop on transfers (or alter these files in transit). In 2017 it would be very shortsighted to consider your internal network as “100% safe”.
  • Only use tools that are available in a standard setup, no 3rd party software.

Secure FTP on Windows

For this blog post I decided to give secure FTP (note, this is not SFTP) a try. Secure FTP is available in Windows Server 2016 via the IIS component.

I started by downloading an evaluation version of Microsoft Windows 2016 server via https://www.microsoft.com/en-us/evalcenter/evaluate-windows-server-2016/ and install it as a VM.

Installing IIS

The first component I had to install was IIS. This is straightforward on a new install of Windows server. Use the Server Manager, select Manage and then Add Roles and Features


The wizard asks you to choose between role-based or RDP. Choose role-based and select the server you would like to configure. Then choose Web Server (IIS)


Add the feature and click a couple of times on “Next”.

We only want a secure FTP service, so there’s no need for the other IIS components. Disable the other components, select FTP and leave the management console for IIS enable.


Then choose Next and Install.

Now configure the IIS component via the Tools menu.


Configure secure FTP server on IIS

The first thing you now have to do is create a certificate. In the IIS administration console choose Server Certificates. You can then import a previously created certificate (preferred) or create a self-signed certificate.


For the purpose of this post I created a self-signed certificate but in a production environment you should import a valid certificate created by your certificate authority.

Configure secure FTP on IIS

Now it’s time to create a secure FTP host. Right click on sites and add FTP host. Select a name and a path where this FTP site points to.


Then choose the option to require SSL and choose the SSL certificate.


The next screen is about authentication. Ideally you should not allow everyone to access the file transfer service. You should create a dedicate Windows (either local or domain) group and then add the users that are allowed to access the server to this group.

For this blog post I also enabled “Basic Authentication” as authentication scheme, in a production environment you can choose your own authentication providers. Similarly, merely for this exercise I did not add other users and used the Administrator account for testing the setup.


That is basically all that is required to setup a secure FTP server on Windows.

Test the secure FTP server

You can then use any FTP client that supports SSL. For example FileZilla


Recommendations

Although the above described process gives you a working setup there are some extra things to consider

  • Use certificate based authentication;
  • Enforce a retention policy for the files on the transfer server;
  • Enable detailed auditing, logging and alerting of access attempts. Include both successful and failed access attempts.
  • Include anti-malware solutions that scan the uploaded files, potentially blocking them if something unwanted has been found.

The goal of this exercise was to have a relatively secure file transfer service that’s easy to setup and use the tools build into Windows 2016. If you are allowed to install additional software then certainly have a look at SFTP or SCP, the file transfer server that runs over SSH.

Mindmap for CRASHOVERRIDE

CRASHOVERRIDE and Win32/Industroyer

Both Dragos and ESET released two reports on the analysis of malware attacking power grids.

According to Dragos the adversary group labeled as ELECTRUM is responsible for the cyber attack on the Ukraine electric grid in 2016.

I created a mindmap based on the info in the Dragos document. It’s available on https://github.com/cudeso/tools/tree/master/CRASHOVERRIDE


Resources

Kerberos made easy

What is Kerberos?

Kerberos is an authentication protocol that works on the basis of tickets that allows clients to connect to services over an insecure network and still allow clients to prove their identity in a secure manner.

The steps described below are a compilation of what I found when reading on Kerberos. Feel free to share your comments!

How does Kerberos work?

These are the steps necessary for a client to obtain an authenticated and verified request to a service (for example a web HTTP service).

Step 1 : Login

The user enters the username and password. In some cases you only have to enter the password in step 5. The client will then transform the password into a client secret key.


Client Server Service
Client secret key    


Step 2 : Request for Ticket Granting Ticket – TGT, Client to Server

The client sends a plaintext message to the authentication server. This message contains

  • username;
  • the name of the requested service (in this case this is the Ticket Granting Server – TGS);
  • the network address;
  • the requested lifetime of the TGT.

Note that no secret information (client secret key or password) is sent).


Client Server Service
Client secret key    
Request for a TGT    


Step 3 : Server checks if the user exists

The server receives the message and will check if the username exists in the Key Distribution Center – KDC. Again this is not a credential check but only a check to verify that the user is defined. If all is OK the server proceeds.

Step 4 : Server sends TGT back to the client

The server generates a random key called the session key that is to be used between the client and the TGS.

The authentication server then sends back two messages to the client

  • Message A is encrypted with the client secret key. The client secret key is not transferred but is retrieved from the password (more to speak the hash) found in the user database. This happens all on the server side. The message contains
    • TGS name;
    • timestamp;
    • lifetime;
    • the TGS session key (the key generated in the beginning of this step).
  • Message B is the Ticket Granting Ticket, encrypted with the TGS secret key, that contains
    • your name;
    • the TGS name;
    • timestamp;
    • your network address;
    • lifetime;
    • the TGS session key (same as in message A).


Client Server Service
Client secret key Client secret key (locally created)  
Request for a TGT TGT  
  TGS session key  
  TGS secret key  


Step 5 : Enter your password

The client receives both messages and then requests the user for the password. In some cases this is already done in the first step. The password is then converted (hash) to the client secret key. Note that this key was also generated on the server side in the previous step.

Step 6 : Client obtains the TGS Session Key

The client now uses the client secret key to decrypt message A. This gives the client the TGS Session key.

The client can not do anything with message B (the TGT) for the moment as this is encrypted with the TGS secret key (which is only available at the server side). This encrypted TGT is stored locally in the credential cache.


Client Server Service
Client secret key Client secret key (locally created)  
Request for a TGT TGT  
Encrypted TGT TGT  
TGS session key TGS session key  
  TGS secret key  


Step 7 : Client requests server to access a service

The client now prepares two messages to be send to the server

  • Message C is an unencrypted message that contains
    • the service that the client wants to access;
    • the lifetime;
    • message B or the TGT (this TGT itself is encrypted and included in the unencrypted message send to the server).
  • Message D is a so called Authenticator encrypted with the TGS session key and contains
    • your name;
    • timestamp.

Step 8 : Server verifies if service exist

The server first verifies if the requested service exists in the KDC. If this is the case, it will proceed.

Step 9 : Server verifies request

The server now extracts the content of message B (the TGT) from message C and then decrypts that message B (the TGT) with its TGS secret key. This will give the server the TGS session key. This is a shared key between the client and the server.

With this TGS session key, the server is now able to also decrypt the message D.

The server now has your name and a timestamp from message D and a name and timestamp from message B. The server will then

  • Compare both name and timestamp in both values;
  • Check if the TGT is expired (the lifetime field in the TGT);
  • Check that the Authenticator is not in the cache (to prevent replay).

If all checks turn out OK, the server continues.


Client Server Service
Client secret key Client secret key (locally created)  
Request for a TGT TGT  
Encrypted TGT TGT  
TGS session key TGS session key  
  TGS secret key  


Step 10 : Server generates service session key

The server generates a random service session key. It will then send two messages to the client.

  • Message E : the service ticket that is encrypted with the service secret key and contains
    • your name;
    • the service name;
    • timestamp;
    • your network address;
    • lifetime;
    • the service session key.
  • Message F : encrypted with the TGS session key containing
    • service name;
    • timestamp;
    • lifetime;
    • service session key.


Client Server Service
Client secret key Client secret key (locally created)  
Request for a TGT TGT  
Encrypted TGT TGT  
TGS session key TGS session key  
  TGS secret key  
  Service ticket  
  Service session key  


Step 11 : Client receives service session key

Because the client has the TGS session key cached from previous steps it can now decrypt message F to obtain the service session key. It is however not possible to decrypt the service ticket (message E) because that one is encrypted with the service secret key.


Client Server Service
Client secret key Client secret key (locally created)  
Request for a TGT TGT  
Encrypted TGT TGT  
TGS session key TGS session key  
  TGS secret key  
Encrypted Service ticket Service ticket  
Service session key Service session key  


Step 12 : Client contacts service

Now it’s time for the client to contact the service. Again two messages are send

  • Message G : a new authenticator message encrypted with the service session key that contains
    • your name;
    • timestamp.
  • Message H : the previously received message E, that is still encrypted with the service secret key

Step 13 : Service receives the request

The service then decrypts the message H (which is the same as message E) with its service secret key. It then uses the service session key (that was stored in message H/E) to obtain the service session key.

The service will then use that newly obtain service session key to decrypt the authenticator message G.


Client Server Service
Client secret key Client secret key (locally created)  
Request for a TGT TGT  
Encrypted TGT TGT  
TGS session key TGS session key  
  TGS secret key  
Encrypted Service ticket Service ticket  
Encrypted Service ticket Service ticket Service ticket
Service session key Service session key Service session key


Step 14 : Service verifies request

Similar to step 9, the service then does some verification

  • Compare the user name from the authenticator (message G) to the one in the ticket (comparing message H/E);
  • Compare the timestamp in message G with the timestamp in the ticket (H/E);
  • Check if the lifetime (message H/E) is expired;
  • Check that the authenticator (message G) is not already in the cache, to prevent replay attacks.

If all checks turn out OK, the service continues.

Step 15 : Service confirms identity to the client

The service will then confirm its identity to the client

  • Message I : an authenticator message encrypted with the service session key that contains
    • the id of the service;
    • timestamp.

Step 16 : Client receives confirmation

The client then receives the authenticator message (I) and decrypts its with the cache service session key (obtained in step 11). This allows the client to know the id of the service and if the timestamp is valid. If everything is OK the client can proceed.

Step 17 : Client communicates with the service

The authentication and verification is finished. The client can now talk to the service. Note that this only involves the authentication and verification of a service. This process will not decide if the client is actually allowed to do the requested service. This is something that is decided by the ACLs within the server that provides the service. This is not part of Kerberos.

Practical example, how Windows uses Kerberos

The most common use of Kerberos is seen in how Windows authenticates users to access a service, commonly known as single-sign on. The steps below map the ‘general’ Kerberos steps to how Microsoft Windows implements Kerberos.

Kerberos Windows Event#
1
5
User authenticates
A user logs in and enters its username and password
 
 
2 Client sends authentication message to the KDC
The client now sends an authentication request to the KDC. This message contains

  • Username
  • Account domain name
  • The client secret key, obtained via the password

 
3
 
KDC contacts AD to verify user
The KDC contacts the AD to authenticate the user and gather the information that is available on this user (groups etc.).
 
 
4 Server replies with TGT
The KDC replies with a TGT that contains

  • A session key, encrypted with the KDC private key;
  • The authorization information for the user.

4768
6
 
Client receives TGT 
7
 
Client requests service ticket
The service ticket contains

  • The requested service
  • The TGT
  • An authenticator, encrypted with the user session key

8
9
 
KDC validates the request
10 KDC returns service ticket
The service ticket contains

  • A session key to share with the service
  • The session key of the client, encrypted with the key of the service

4769
11
12
 
Client sends service ticket to service

 
13
14
15
 
The service validates the request
The service then validates the request by decrypting the service ticket.
 
16
 
Client receives confirmation
17
 
Client communicates

Take-aways for Kerberos

Making use of Kerberos provides these advantages

  • Passwords are never transmitted over a network connection
  • It allows for single-sign-on (SSO)
  • The Kerberos protocol lays a foundation for interoperability with other networks in which the Kerberos protocol is used for authentication.
  • Authentication can be delegated
  • Mutual authentication : Both users and machines need to authenticate. This provides an assurance that service tickets are only used by the intended machine. Also, only the targeted machines can then validate the requested service ticket.
  • Look for Windows events 4769 for session creation, either locally or via remote.
  • There are a couple of interesting Windows events that you need to log and monitor :
    • 4768 : A TGT was requested
    • 4769 : A service ticket was requested
    • 4770 : a service ticket was renewed
    • 4771 : pre-authentication failed
    • 4772 : authentication ticket request failed
    • 4773 : A service ticket request failed

Definitions

  • KDC – Key Distribution Center;
  • TGT – Ticket Granting Ticket;
  • TGS – Ticket Granting Server.

References