I had a guest post published on Sharing Encryption Keys: A Practical Example With GPG.
Stay Up-to-Date on Security News with OPML feeds
Stay Up-to-Date on Security Trends
In 2015 I did a posting on the Security Intelligence blog on How to Stay Up-to-Date on Security Trends. The post describes how you can streamline the process of following different news and threat information channels, classify them and bring them to good use.
One of the tools that you can use is RSS feeds. I personally use a setup of fever to grab different RSS feeds and then have them delivered in one central RSS feed. This makes it easy for me to scroll through the different news items and mark the interesting articles for later reading.
OPML Security Feeds
I wanted to share my feeds with the community. The easiest way of sharing these feeds is through OPML files. OPML is an XML format for exchanging lists of Web feeds. You can import OPML feeds in most RSS readers.
You can find my OPML files in the GitHub repository : OPML-Security-Feeds. Feel free to contribute or mark older feeds as stale.
Using open source intelligence feeds, OSINT, with MISP
MISP
I love MISP, Malware Information Sharing Platform & Threat Sharing. I did three earlier posts on how to use and setup MISP. part 1, part 2 and part 3.
Open Source Information by MISP, OSINT
One of the nice new features by MISP is including feeds from different open source intelligence feed providers.
How does it work? Basically the feeds are provided as a JSON feed, you can browse them within MISP, import them individually or subscribe to the feed to get automatic updates.
Using OSINT feeds within MISP
First I assume that you upgraded MISP to the latest version. This is straightforward by pulling the latest version from Github.
git pull
Once this is done, log in to your MISP instance and go to Sync actions, List Feeds. You will then get a list of the available open source feeds.
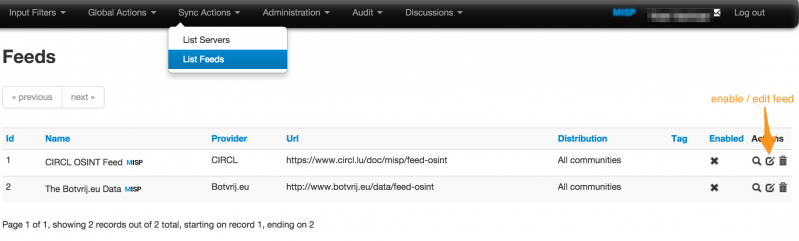
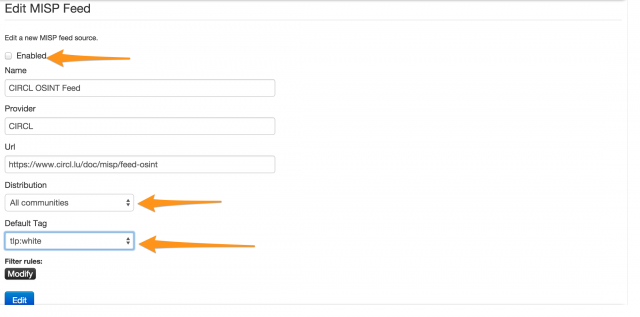
Then you will need to enable or edit a feed. This will bring you to a screen where you can set the default distribution level and most importantly, the default tag.
For my setup I use the TLP:White tag. Remember that these tags are defined in the taxonomies that you have defined in MISP (see Event Actions -> List Taxonomies). I use TLP:White because OSINT information is by default TLP:White. Not sure about the TLP code? Use the post How to use the traffic light protocol – TLP.
Do not forget to tick the checkbox Enabled because otherwise the feed will not be enabled.
Once you have edited the feed you will return to the overview of available feeds.
You can browse the feed content. Do this for the feed that you enabled.
This will result in a an overview of the open source events from that feed. You can now select an invidividual event to be included in your MISP instance.
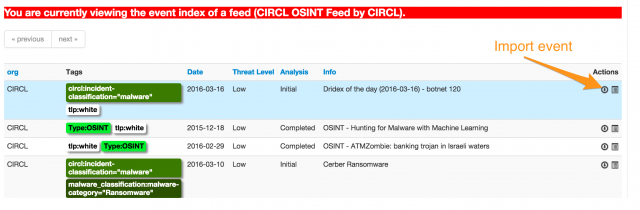
Basically that is all there is for including an open source feed to your MISP data.
- Enable a feed
- Set the distribution-level and tag it
- Sit back and enjoy
I want to contribute open source intelligence feeds
Using the OSINT feed is great but maybe you also want to contribute your OSINT feed to the community? You can. And it’s fairly easy. For this you need to use a Python script : PyMISP.
PyMISP
PyMISP is a Python library using the MISP Rest API. In essence this means that instead of crafting MISP API requests you can use Python request to interact with MISP.
Installing PyMISP is described on the GitHub page.
git clone https://github.com/CIRCL/PyMISP.git
cd PyMISP
python setup.py install
Basically it needs an API key and a URL. This can be set in any file you desire as long as you include it in your Python script that calls PyMISP. As an example you can use this in you Python scripts
from pymisp import PyMISP
from cudeso import misp_key
from cudeso import misp_url
from cudeso import misp_verifycert
This will import the API key and url from an external file.
Using PyMISP for OSINT
Once you have setup PyMISP you can use one of the example scripts to generate the OSINT feed. In the folder PyMISP/examples/feed-generator/ there are two files that you need to edit. Note that the OSINT generator script does not use the configuration script of PyMISP described above.
First you need to edit the file settings.py. The important settings to change are
url = '<MISP-URL>'
key = '<MISP-automation-key>'
outputdir = 'output-dir'
The MISP url (url) defines where the script can find you MISP instance. The automation key (key) is the key set by your automation user. Finally the outputdir sets where you want to output the files. Note that this directory will hold all the MISP events. You have to make sure that this directory
- is writable by the generate script
- is a separate directory
- accessible by the public if you want to publicize your feed (for example in your web directory).
Once you have set these settings you can run the feed generator script by issuing
./generate.py
This will generate all the MISP events in the output directory set by “outputdir”.
Make your feed known!
If you are happy with your feed you should announce it to CIRCL to have it included as one of the OSINT feeds in the next update of MISP. The easiest way for doing so is via the MISP GitHub repository.
Existing open source feeds
The current release of MISP contains these OSINT feeds
- https://www.circl.lu/doc/misp/feed-osint
- http://www.botvrij.eu/data/feed-osint
I maintain the feed for botvrij.eu. If you want to include a description of a threat info then you can send me a MISP XML file or a pointer to a public description.
The New Glibc Getaddrinfo Vulnerability: Is It GHOST 2.0?
I had a guest post published on Security Training for Incident Handlers: The New Glibc Getaddrinfo Vulnerability: Is It GHOST 2.0?.
The post describes the critical issue found in glibc getaddrinfo (CVE-2015-7547) and gives you advice on patch management to deal with current (and future) issues in glibc.
Security Training for Incident Handlers: What’s Out There?
I had a guest post published on Security Training for Incident Handlers: What’s Out There? on the blog of IBM’s Security Intelligence.
The post describes the different types of security trainings that are available for incident handlers, including vendor-specific training, general training and community driven training.
9 Things To Know When Using The GDPR To Your Advantage
I had a guest post published about 9 Things To Know When Using The GDPR To Your Advantage on the blog of Ipswitch.com.
The post focuses on important things in the GDPR, General Data Protection Regulation, that can have an influence on how you deal with some of your user -personal- data.
Using Passive DNS for Incident Response
What is passive DNS?
According to isc.org “Passive DNS” or “passive DNS replication” is a technique invented by Florian Weimer in 2004 to opportunistically reconstruct a partial view of the data available in the global Domain Name System into a central database where it can be indexed and queried.
In practical terms passive DNS describes an historical database of DNS resolutions. What does this all mean? It means that you can lookup to what IP address a domain resolved in the past. This is even the case if that domain has been removed from the nameservers and is no longer available.
Important to note is that with passive DNS normally only the server to server communication is captured. The queries from stub-resolvers (typically that’s the local software preparing the DNS query) are not taken into account.
Why would you use passive DNS?
Passive DNS is very useful when doing incident response investigations.
Imagine a case where you receive information that a certain type of malware is using a domain “update.newaptvers.ion”. When you receive the information from your peers and you try to resolve the domain it points to 8.8.8.8. Using this IP address as an IOC is going to give you lots of false positives (for info: 8.8.8.8 is Google DNS). Now with the use of passive DNS you are able to look up to what IP address(es) this domain resolved in the past. If the domain has been captured by passive DNS sensors you will get a set of network IOCs that you can use to conduct a further investigation.
Passive DNS – Common Output Format
There is an Internet-Draft, draft-dulaunoy-dnsop-passive-dns-cof-01, describing a common output format of Passive DNS Servers which clients can query. You can query passive DNS servers that support COF with a client API via for example PyDNS. The result of your query will then be in JSON format.
In this post I will not cover PyDNS but PassiveDNS::Client, a Ruby application to do passive DNS queries. Currently PassiveDNS::Client has not yet support for this common format but I found this tool to be the only one that has flexible support for lookups on different passive DNS servers.
PassiveDNS::Client
Different servers
The PassiveDNS::Client has support for different passive DNS servers
- BFK.de
- Mnemonic
- PassiveDNS.cn
- CIRCL
- VirusTotal
- PassiveTotal
- DNSDB
The most useful supported server, in my opinion, is the one for PassiveTotal. PassiveTotal by itself already allows you to enable other external sources for retrieving data making the results more useful.
Install and configuration
Installing the PassiveDNS::Client is described in detail on the GitHub page. The steps to get it installed boil down to
git clone https://github.com/chrislee35/passivedns-client.git
cd passivedns-client.git
sudo gem install passivedns-client
Once installed you have to create the configuration file, typically found in $HOME/.passivedns-client.
For this post I use PassiveTotal and VirusTotal so my config file looked like this
[virustotal]
APIKEY = key
[passivetotal]
APIKEY = key
Using passive DNS
Test case for incident response
How would you use the passive DNS client? Imagine you were doing incident response based on a set of IOCS (and flash back to mid-2015). In this case I start with the IOCs for Operation Potao provided by ESET. The IOCs contain a number of domain names like for example the domain truecryptrussia.ru.
If you now do a lookup of the domain you will notice that it resolves to 104.27.168.41. That IP is part of CloudFlare. Doing a research based on hits to the CloudFlare network is not feasible in a large network (or in a small network, it will be very difficult to draw conclusions based on hits to CloudFlare).
This is where passive DNS can help. If you query passive DNS servers (in this case I use PassiveTotal and VirusTotal) you get a history of the DNS records for this domain.
pdnstool -dp -dv -t truecryptrussia.ru
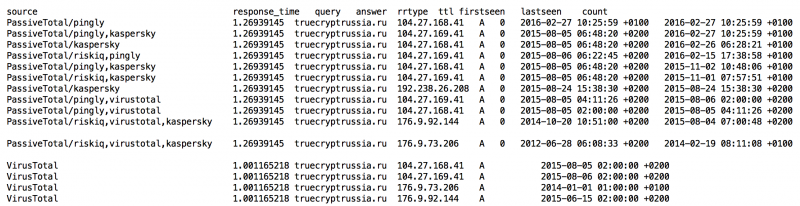
For this domain you can see that there are a lot of registrations pointing to CloudFlare. However there are also three registrations not pointing to CloudFlare. If you are doing an investigation around mid of 2015 then you can certainly use the IPs 192.238.26.208 and 176.9.92.144 to check for traffic in your network. The other IP, 176.9.73.206, seems to be to “old” (last seen early 2014).
Note that the listed domain and investigation steps are only listed for demonstration purposes to show you how an investigation could take place based on passive DNS data.
As an extra : sometimes attackers will first use some “probes” (either towards your network or by silently testing if unusual outbound traffic is detected). If they use the same domain name for these probes but later on switch to a different network for conducting the mass of the attack you will still be able to reconstruct what happened, based on the network information gathered via passive DNS.
Output formats
PassiveDNS::Client supports a number of output formats. The default is to print out the results on the console (by default tab-delimited). If you would like to automate the process of enriching your intelligence database you will probably use JSON, XML or CSV support. These are a couple of the settings that you need to supply for getting a different output format :
- -c CSV
- -x XML
- -j JSON
- -t ASCII text
Querying different servers
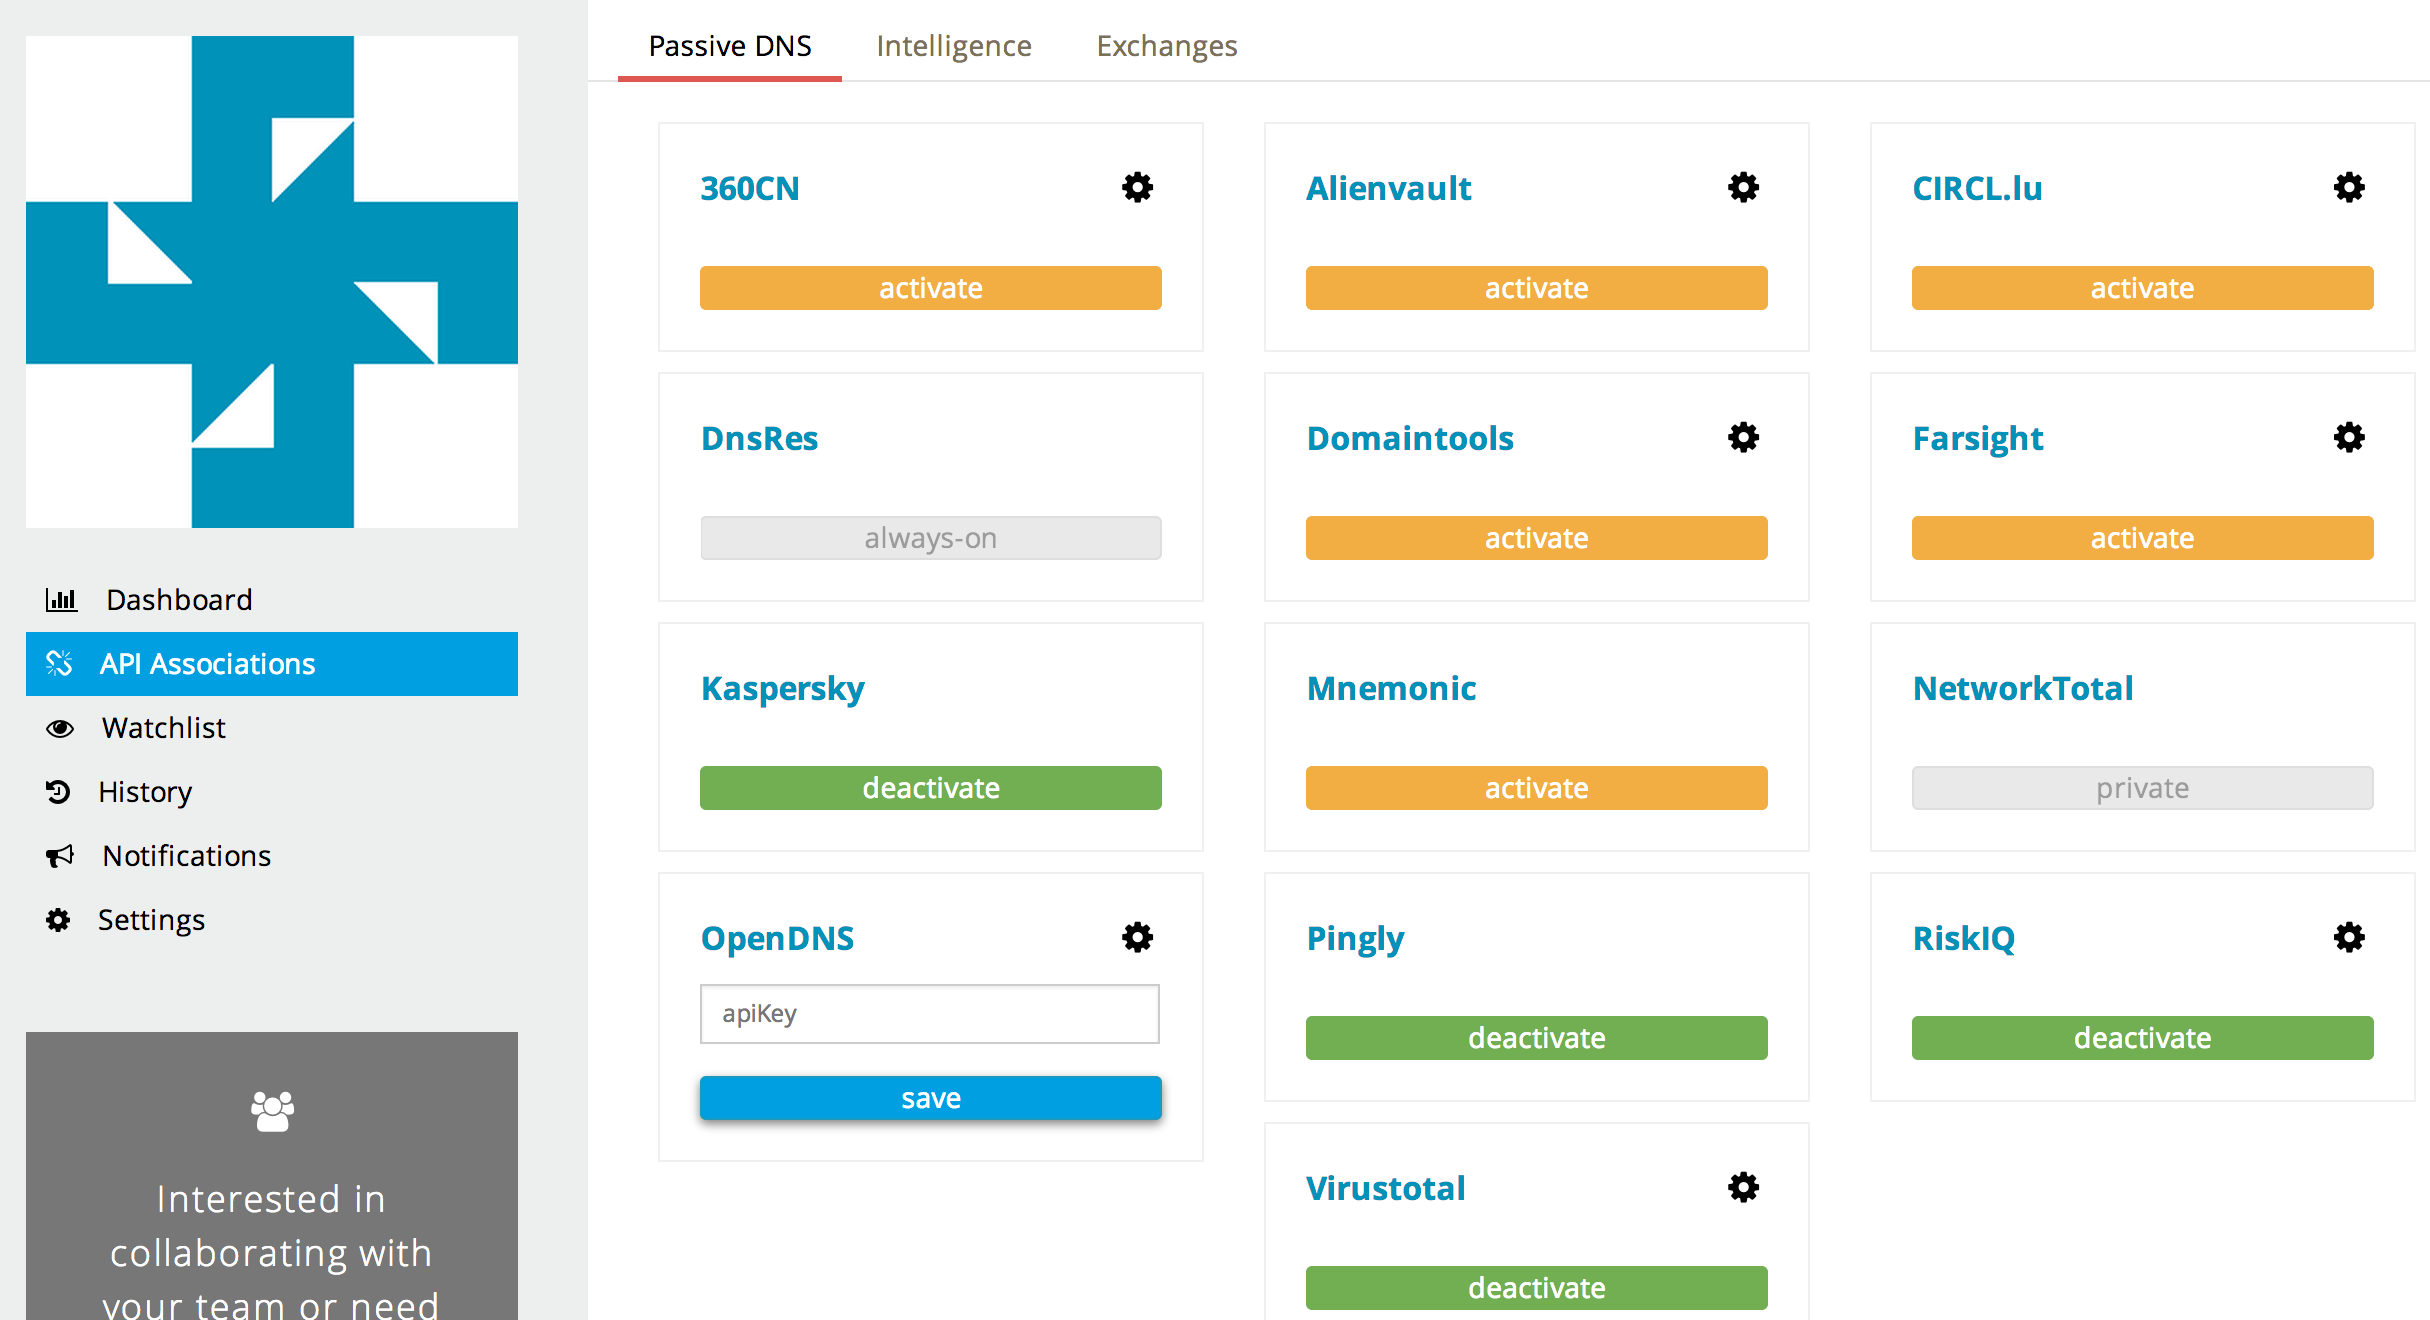
In the example given above I used PassiveTotal and VirusTotal. PassiveDNS::Client also supports other servers like for example
- -d3 use 360.cn
- -dc use CIRCL
- -dd use DNSDB
- -dp use PassiveTotal
- -dv use VirusTotal
Running your own passive DNS server
Passive sensors
There are a couple of options for running your own passive DNS server. You can run a passive DNS sensor provided by Farsight Security. This allows you to contribute to the existing dataset and make it more valuable, for you and for the community.
Another option is to run your own passive DNS sensor and using the data only internally. The best option that I found for this was using passivedns from Gamelinux.org. From a high level view this is a network sniffer that extracts DNS packets and stores them in a log file. You can then use a Perl script to monitor the log file and store the events in a sql database.
Combining with Moloch
I just started experimenting with running Moloch for grabbing the entire network traffic. Moloch stores network traffic details (either from sniffing or from pcap files) in a central database for later processing.
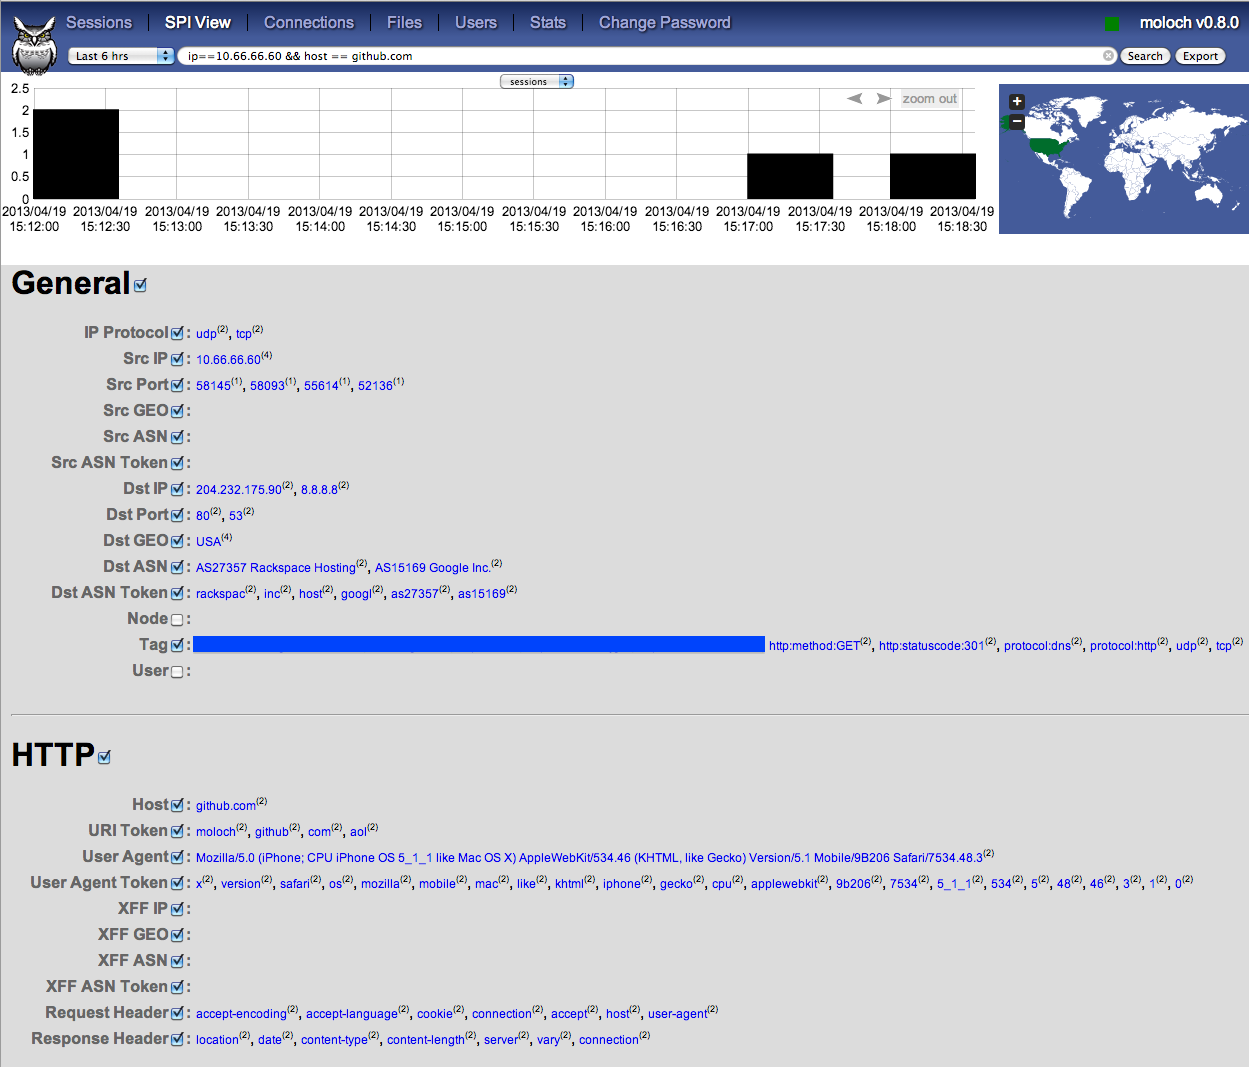
(image from https://n0where.net)
Moloch has a feature that allows you to query only the DNS queries but I found it a bit cumbersome to extract all the queries (and results) that happened for a specific domain name over a given time frame.
This is where I used a different instance with passivedns that looks at the same traffic. Note that passivedns is also able to read the pcap files, it is not limited to only live traffic.
A security colleague explained a working setup with an IDS storing the individual pcap files (for example rotated every 100MB) and then later processing the pcap with Moloch (a post on this is coming soon). I added a post-process task with passivedns on the same pcap files that extracts domain information and query results and then makes the data available in a sql database.
This setup allows me to get the best of both worlds. Three worlds in fact :
- Using Moloch to look at the entire packet-stream
- Use a local passive DNS to look for queries (and their results) that happened on the local network
- Zoom in on suspicious data and use PassiveDNS::Client to get external passive DNS data and enrich the database
Remarks on the location of the sensors
The numbers of sensors that you can place will always be limited so you have to choose the location wisely. If your users are allowed to do DNS queries directly to the internet you might be missing out on data because the traffic is not seen by the sensor. Ideally you request users to use your own DNS server and block all other outgoing DNS traffic. Additionally this also allows you to more easily implement blocklists on DNS level. Your company-network DNS server then makes a great place to put a sensor.
Conclusion
I knew about passive DNS for a while but I’ve never came to putting it to use. Some informal talks during the last FIRST Technical Colloquium introduced me to Moloch and playing around with it gave me the idea for putting it together with passive DNS.
All in all I think passive DNS (both online and offline) is a very valuable source of information if you have to conduct an investigation.
DDoS Protection by country based filtering
DDoS prevention
DDoS prevention is a hot topic. DDoS attacks have become a weapon of choice for malicious actors to conduct cyberattacks. I did a posting on Defending Against Apache Web Server DDoS Attacks and contributed to a DDoS: Proactive and reactive measures document from CERT.be.
Country based IP filtering
One of the mitigation measures that you can apply is doing country based IP filtering. This basically limits access to your network from a limited set of prefixes. I consider this as a last resort when other mitigations do not help.
Country based IP filtering is based on only allowing prefixes that belong to ‘your’ country. Where do you get these prefixes? Via the BGP announcements! For Europe, RIPE.net makes this list available via ftp://ftp.ripe.net/pub/stats/ripencc/delegated-ripencc-latest. Based on the information in the blogpost Generating country IP ranges lists I added a script to my tools section on Github.
Get if from https://github.com/cudeso/tools/blob/master/ip_per_country/ip_per_country_ripe.py.
Usage is
./ip_per_country_ripe.py BE
This will result in
5.23.128.0/17
5.35.192.0/21
5.134.0.0/21
5.149.136.0/21
5.255.128.0/21
31.12.64.0/21
31.14.50.0/23
...
You can then use this list in your access routers or firewalls. Note that such a filterlist should only be applied as a temporary measure. It basically ‘closes’ the borders and partially does what attackers want to achieve : make your service un-available.
Secure Communication
I recently had a presentation and information session for human right activists on how to secure their group communication and data sharing.
The target audience was non-technical using different operating systems (Windows, Linux and OSX) and using both default laptops and mobile devices (primarily Android based).
I uploaded the presentation to SlideShare.
Doing open source intelligence with SpiderFoot
Open source intelligence
Open source intelligence is collecting information from publicly available resources. If you are doing incident handling it’s one of the things that will use up a lot of your time. And it can quickly become very tedious. Imagine a list of IPs that you found hosts on your network connecting to. Query different public available resources (VirusTotal, Shodan, SANS, Cymon, XForce Exchange, …) for each and every IP and then converting that data into one uniform dataset is time-consuming.
I started developing my own tool (host-enrich on Github) for collecting this type of information but by coincidence I stumbled on a tool that had almost everything that I needed.
Enters SpiderFoot.
SpiderFoot
SpiderFoot automates open source intelligence. It’s a modular platform written in Python that gathers data from different sources and presents the data visually and allows for exporting data.
This post describes the use of SpiderFoot with a focus on gathering passive reconnaissance data and getting the data in an easy accessible (CSV) format.
It is important to note that this post is based on the changes that I commited to my fork of SpiderFoot. Not all changes have yet been committed as pull requests. Pending the pull requests I advice you to use the source in my Github fork at https://github.com/cudeso/spiderfoot.
The default source is available on Github. The installation and setup is described in detail in the online documentation.
Get started with SpiderFoot
Once downloaded and extracted you can start SpiderFoot easily with
./sf.py 192.168.168.1:5001
This commands has it running on port 5001 on the IP 192.168.168.1.
I you start SpiderFoot you should immediately head to the Settings tab. The left part of your screen will list the available modules. If you already have API keys then this is a good time to add them. For example the modules for Cymon, Shodan and VirusTotal require an API key. Add your keys and click Save Changes.
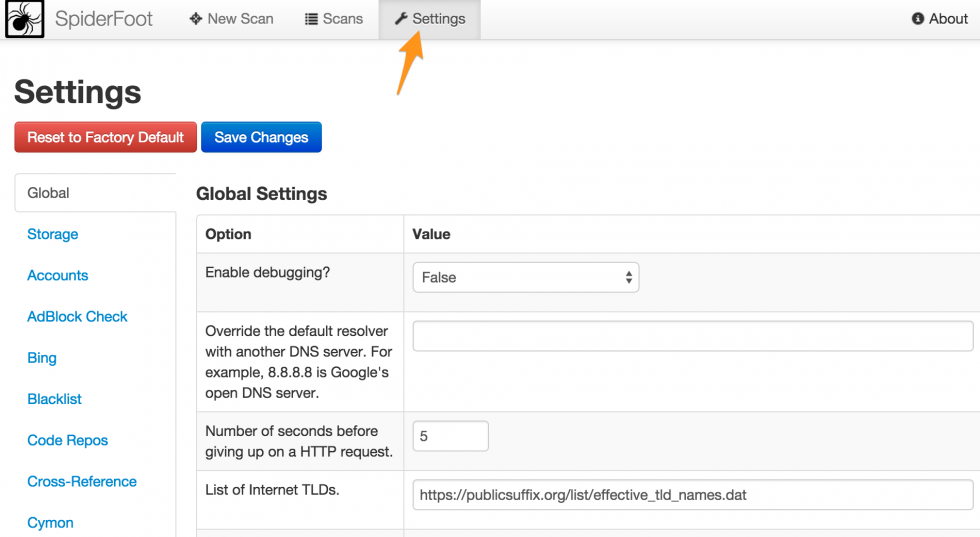
None of this data is sent outside of your network. Everything is stored locally in a sqlite database.
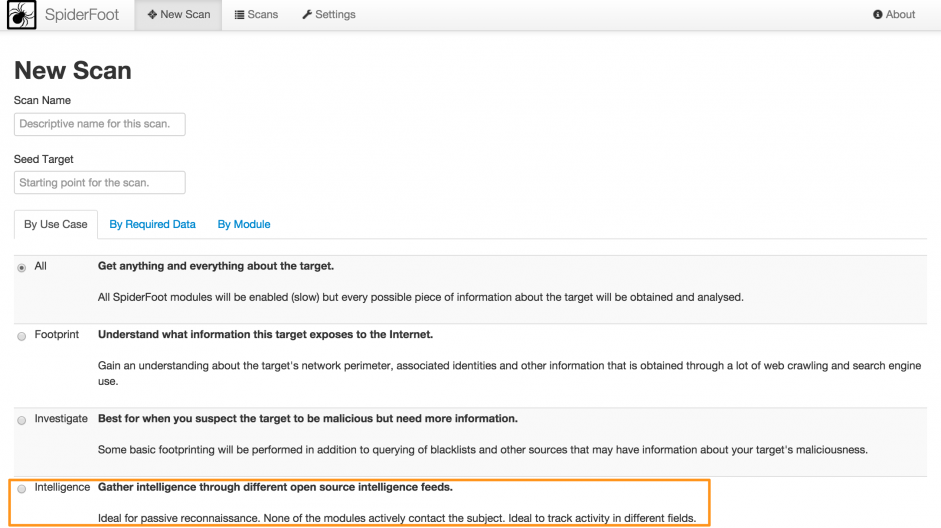
The next thing you want to do is start a New Scan. I advise you to use the Intelligence use case (note that this is one of the code changes that I added). Enter a descriptive scan name, a scan target and click Run Scan. For this post you can use the IP 211.202.2.97 as an example.
You’ll get visual feedback on the scan progress. Further details on the scan progress can be found in the log section.
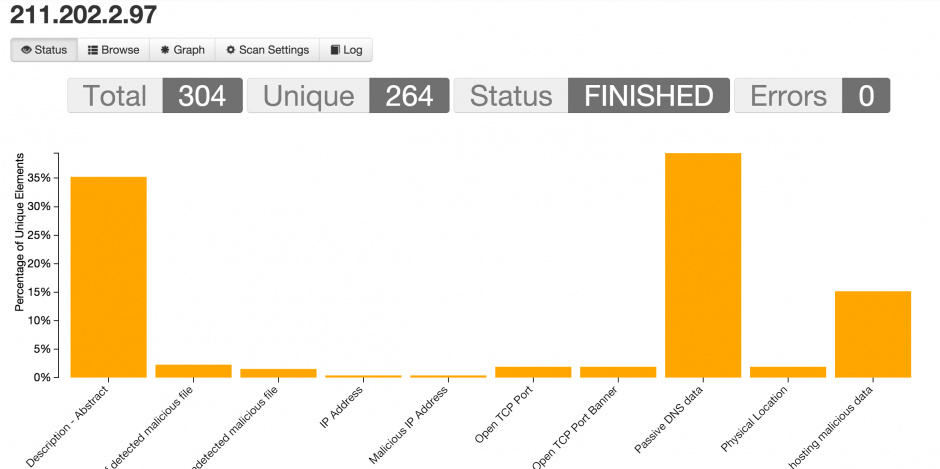
Once the scan is finished you get an overview of all the elements that have been found.
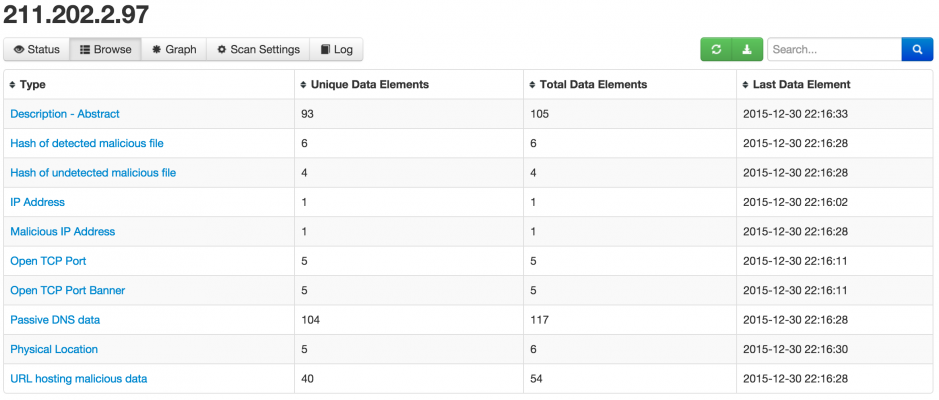
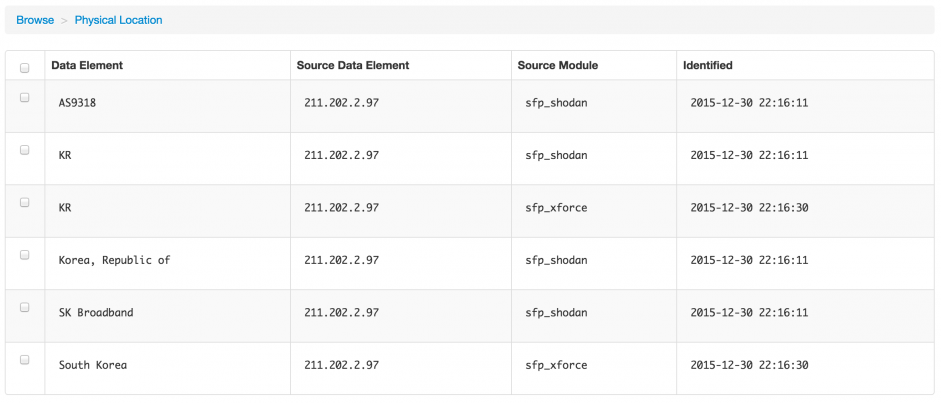
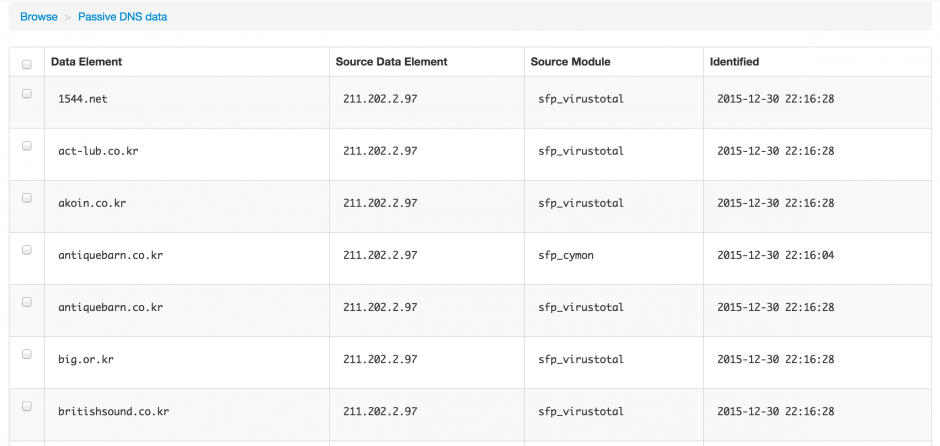
You can also drill down on the data that was found and get for example the physical location, the passive dns data records or the URLs that were hosting malicious data
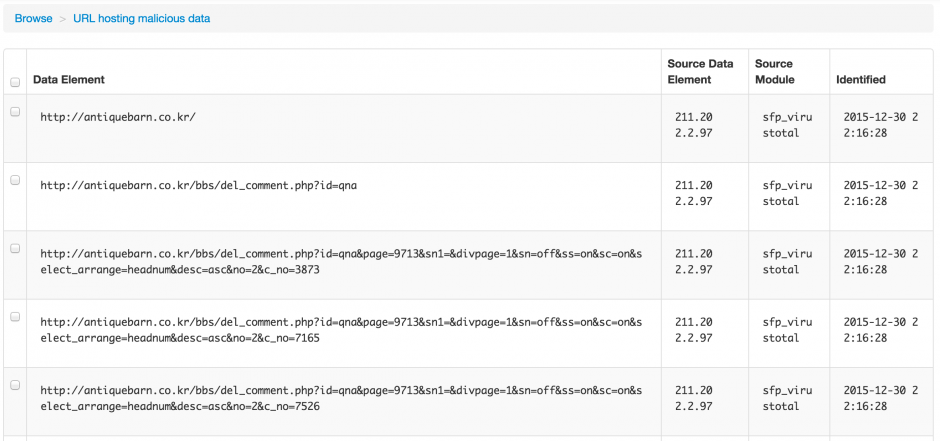
As a last step you can now export the data, either globally or per item found.

Passive reconnaissance with SpiderFoot
Passive reconnaissance is an attempt to gain information about targeted computers and networks without actively engaging with the system. When you are dealing with “malicious” IPs or domains this is very important. Contacting an IP (especially when you’re not using a proxied-connection, see below for proxy integration) that is involved with malicious activity on your network is basically giving away you found out about its presence. This is something that you should avoid.
SpiderFoot comes with use cases. I added a use case Intelligence that groups all modules that do passive reconnaissance, solely relying on third party public sources. Of course, nothing prevents the bad-guys from monitoring the use of these sources but that’s another issue.
You can easily add or remove modules from this use case by changing the sourcecode. A module is added to a use case via a comment setting in the class definition. For example the VirusTotal module this is set to
"""VirusTotal:Investigate,Intelligence:Obtain information from VirusTotal about identified IP addresses."""
This means that the VirusTotal module is used in the use cases Investigate and Intelligence. Finding out which modules are included in the Intelligence use case can be done via
fgrep -R Intelligence modules/*
modules/sfp_cymon.py:    """Cymon:Investigate,Intelligence:Obtain information from Cymon, a tracker of open-source security reports."""
modules/sfp_sansisc.py:    """SANS_ISC:Investigate,Intelligence:Obtain information from SANS ISC about identified IP addresses."""
...
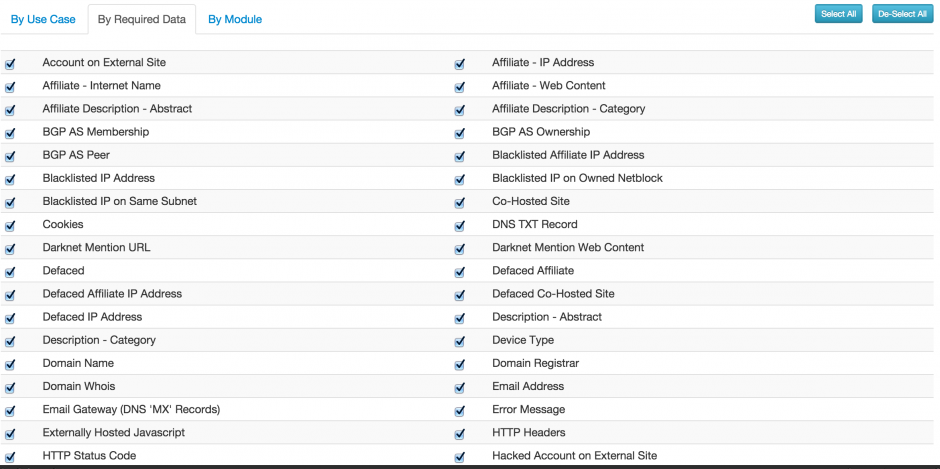
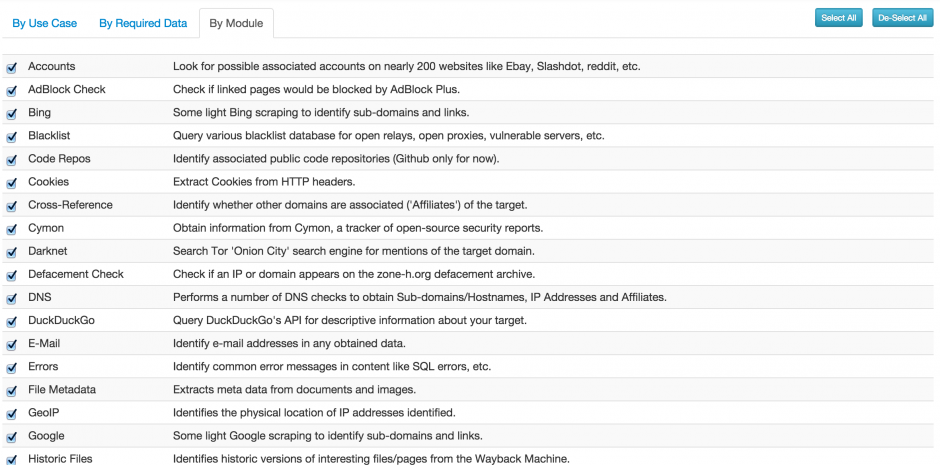
Searching for specific intelligence
Next to performing a search by use case you can also search for a specific type of data with the “By Required Data” or “By Module” search. These become more useful if you know exactly what type of information you are looking for. Remember that some of the modules will interact with the search subject.
Command line interface
The web interface of SpiderFoot is great but sometimes a command line interface is easier when dealing with large sets of scans or if you want to use SpiderFoot for automation.
I included in my code fork a command line script to interact with SpiderFoot. It is very basic and primary focused on using the Intelligence use case.
You can start the script with
/sf_cli.py myScan 211.202.2.97
This will launch a scan named ‘myScan’ for intelligence data on the given IP. The output is a CSV-formatted set of data.
myScan,2015-12-30 21:18:13,URL_MALICIOUS,sfp_cymon,211.202.2.97,0,http://zenocompany.com/catalog/images/alexis.php
myScan,2015-12-30 21:18:13,URL_MALICIOUS,sfp_cymon,211.202.2.97,0,http://zenocompany.com/pshop/news_skin/file.php
myScan,2015-12-30 21:18:13,GEOINFO,sfp_sansisc,211.202.2.97,0,ip-adm@hanaro.com
myScan,2015-12-30 21:18:13,DNS_PASSIVE,sfp_cymon,211.202.2.97,0,jsoft21.co.kr
myScan,2015-12-30 21:18:13,DNS_PASSIVE,sfp_cymon,211.202.2.97,0,mdasj.co.kr
myScan,2015-12-30 21:18:13,DNS_PASSIVE,sfp_cymon,211.202.2.97,0,redbrick.co.kr
The configuration of the script is inline. Change the csf_host and sf_port for your configuration.
csf_host = "192.168.171.159"
sf_port = "5001"
sf_usecase = "Intelligence"
verbose = False
The script submits the scan requests, waits 10 seconds (set in the variable time_sleep) for the scan to finish and then returns a CSV output.
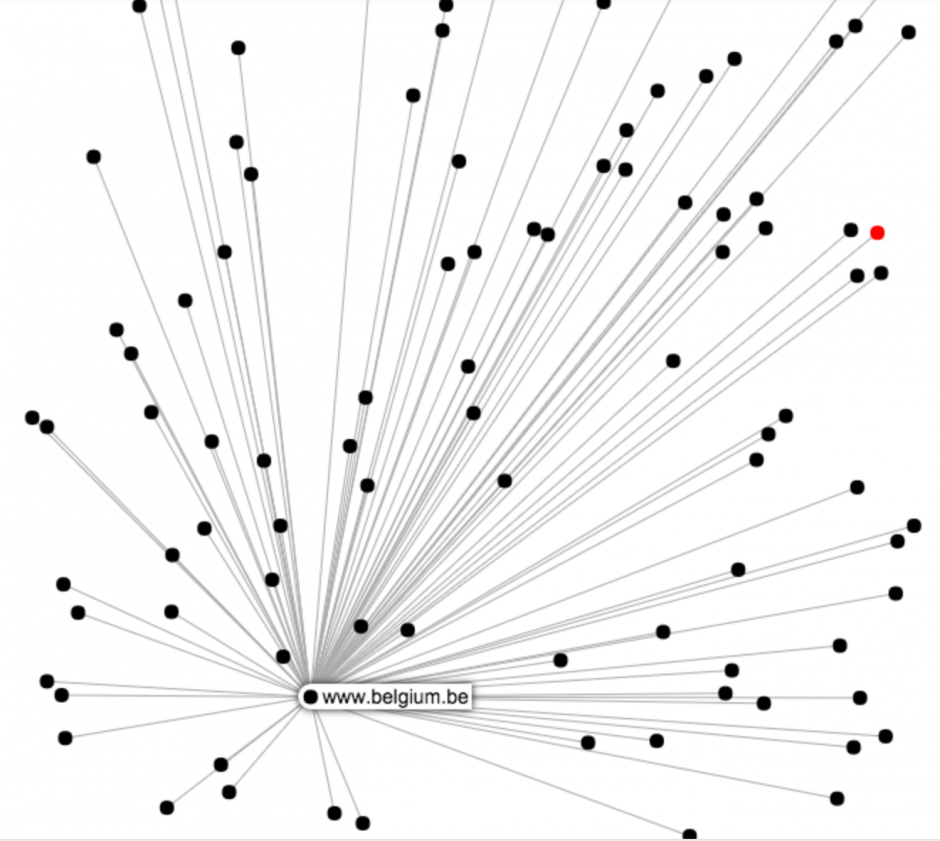
Visual representation
SpiderFoot also supports the visual representation of the data that has been found. I’ve not used this a lot but for some purposes this can give you an immediate overview of how the different data elements are inter-connected.
Proxy integration
If you plan on query your search subject directly I strongly advice you to use some sort of proxy that routes your traffic through an “anonymous” network. SpiderFoot has build-in integration for Tor (see the Settings page). Alternatively you can also use a proxy and export your session to use a designated proxy.
Future integration
SpiderFoot will see a lot of future development. One of my future ideas is to develop an interface with MISP, Malware Information Sharing Platform & Threat Sharing. I wrote about MISP before in three posts (Getting started with MISP, Malware Information Sharing Platform & Threat Sharing). The basic idea would be to
- Query a MISP instance for a subject, return the info found in MISP for that subject;
- Enrich a MISP event with data found for a given subject.
Next to the MISP integration it would also be great to export the SpiderFoot data immediately to Elasticsearch. That way I would be able to interconnect them with the data found in honeypots or enrich it with Twitter data (Tweetsniff).
Additionally, besides MISP, I’d also like to have SpiderFoot talk to a nfdump-nfsen sensor (alerts from nfsen, automatically investigate the remote side of the connection).
Conclusion
SpiderFoot is a tool that saves me a lot of time. Instead of manually having to query VirusTotal, Cymon, Shodan and other sources I can now do this with one command.
I primarily use the command line interface and then import the CSV in a central database.