A short introduction on 5G. What is 5G, why do we need it and where will it be used?
5g 101 from Koen Van Impe
If you want to read about the security threats on 5G then these are a couple of interesting resources:
A short introduction on 5G. What is 5G, why do we need it and where will it be used?
If you want to read about the security threats on 5G then these are a couple of interesting resources:
Your users are the first line of defence against threats, especially for what concerns phishing. One of the ways to get more involvement is offering a simple and easy way to report suspicious messages, such as phishing e-mails. You can do this via a phishing alert button that allows users to notify the helpdesk of a suspicious message. The technology behind such a button is straightforward:
Instead of starting from scratch you can use the -free- Phish Alert Button (PAB) from KnowBe4.
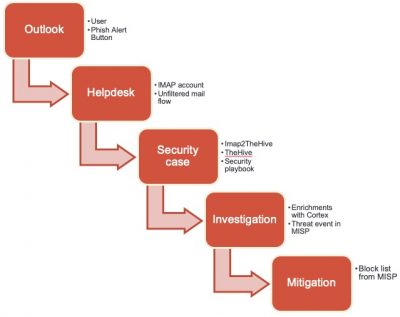
The pipeline to handle phishing e-mail notifications from users is as follows.
The first step is to create the button. You can use this video as a guide. I did these modifications.
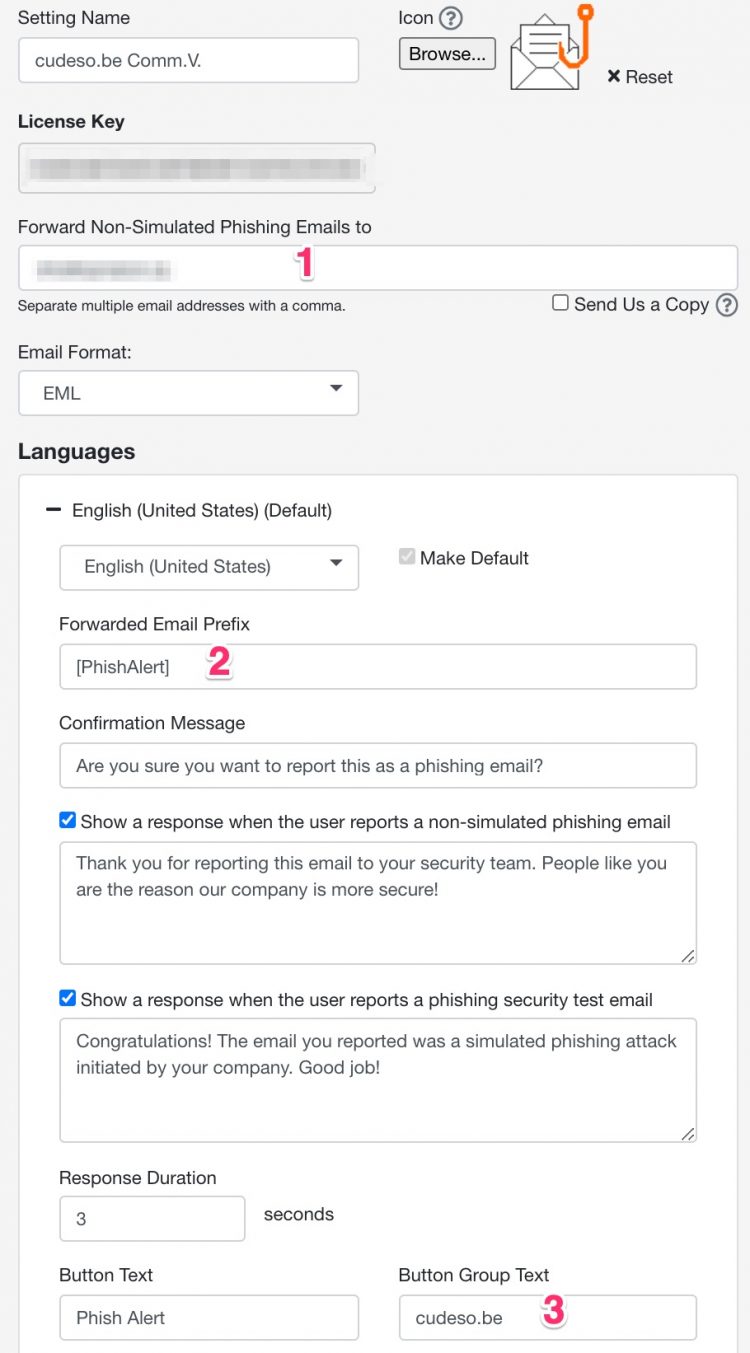
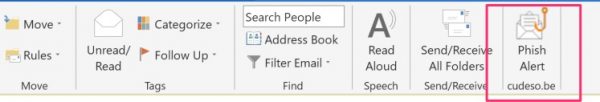
Apart from these settings, there’s really nothing more that you need to configure. If you save your changes you can then download the button as an installable MSI file. After the installation of the MSI and restarting Outlook you’ll notice the button in the Outlook ribbon.
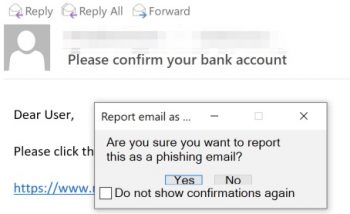
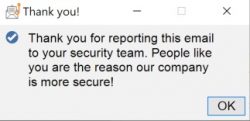
Users can then report a suspicious e-mail by clicking on the button. They are prompted to confirm the action, given a thank you message afterwards and then the e-mail is forwarded to the helpdesk and removed from their inbox.
The IMAP2TheHive tool from Xavier Mertens does the heavy lifting. This tool reads the IMAP folder that receives the phishing notices and then creates individual security cases in TheHive. These changes have been done to the configuration file.
[case]
tlp: 2
tags: email
template: Phishing
files: application/pdf,application/octet-stream
I run the IMAP2TheHive script via cron and it’s executed every 15 minutes. Afterwards you’ll see a new case created in TheHive. The new cases contains a number of tasks, which have been defined in the phishing handling playbook.
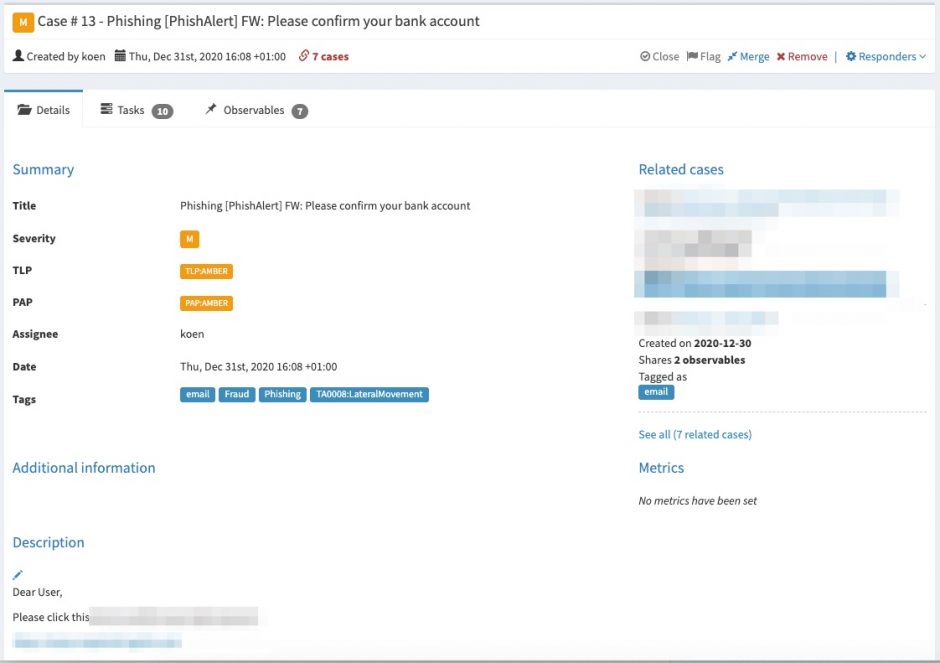
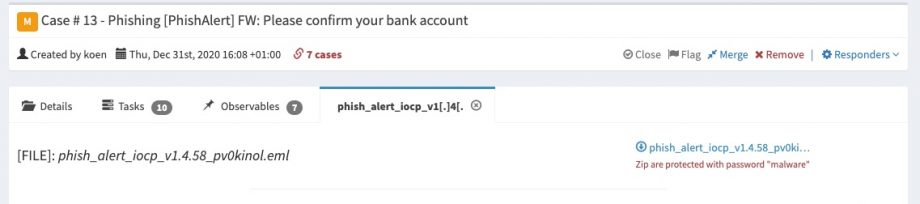
One of the observables in the security case in TheHive contains the original e-mail. This allows the analysts to review for example additional e-mail headers.
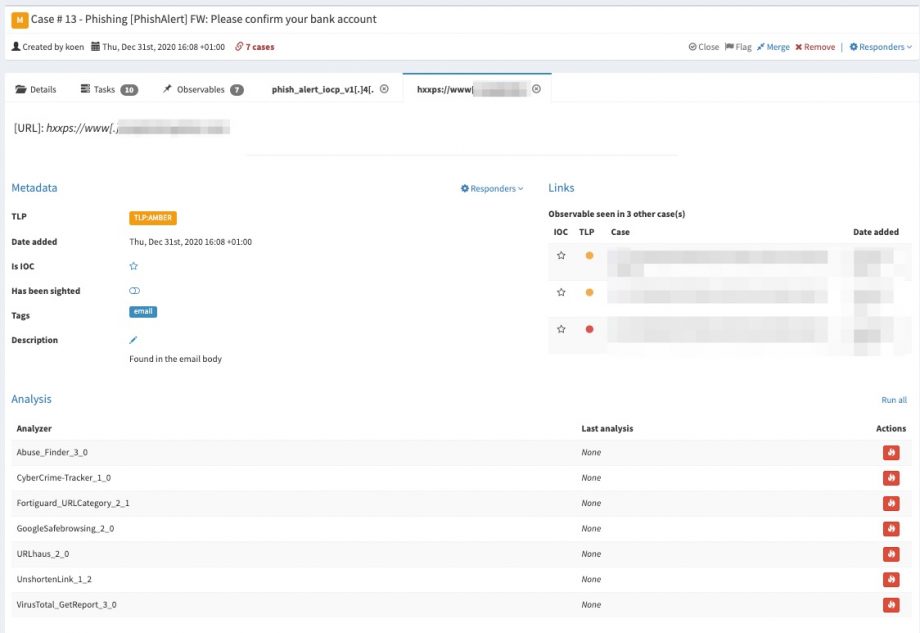
The import script automatically extracts useful indicators such as URLs found in the phishing e-mail. You can then use Cortex to verify if these (phishing?) URLs exist with Google SafeBrowsing or if the purpose or goal of these links is known with Virustotal.
I described in another post how to create a block list from data in MISP, see Feed honeypot data to MISP for blocklist and RPZ creation. The integration of MISP with TheHive is explained in detail in a post from TheHive : TheHive, Cortex and MISP: How They All Fit Together.
Happy filtering!
In a previous article I described how to defend with the courses of action matrix and indicator lifecycle management. The courses of action matrix describes passive and active actions that defenders can take with a varying type of impact on the attacker (or intrusion). The Permissible Actions Protocol or PAP achieves something similar, but with a focus on what defenders are allowed to do.
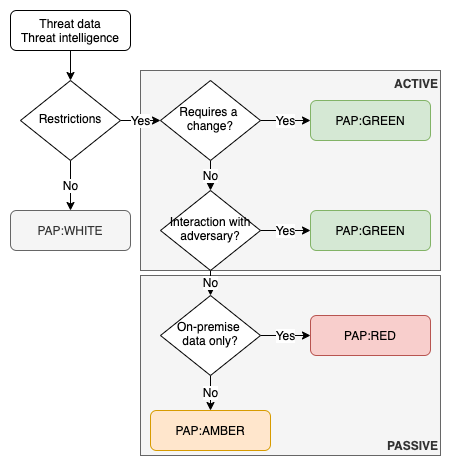
PAP is a protocol that describes how much that we accept that an attacker can detect of the current analysis state or defensive actions. It is designed to indicate what the receiver may do with the information and it achieves this by using a colour scheme.
PAP bears ressemblances with TLP or the Traffic Light Protocol because it makes use of the same colour scheme.
Note that contrary to TLP, where sources can specify additional sharing limits for TLP:AMBER, no such exceptions exist for PAP:AMBER.
Foremost, PAP is designed to be used by analysts, operational staff or defenders.
PAP is included as a MISP taxonomy and is supported by TheHive.
PAP is primarily designed for human consumption. Where the courses of action can be used to automate follow-up actions, for example to automatically create filter deny lists, PAP is rather to be used by humans.
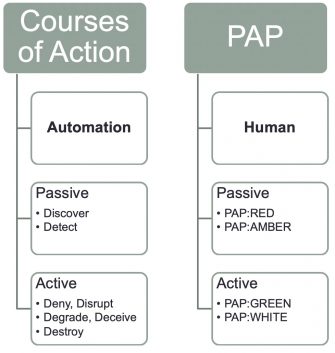
There are overlaps between PAP and the courses of action matrix.
Some automated enrichment process can hinder the proper use of PAP. For example certain SIEMs or anti-virus consoles can do host lookups (DNS) in the background. This almost always involves querying external DNS servers, which can alert adversaries of an ongoing investigation. Note that this is also the case for MISP if you enable the hoover-enrichment plugins.
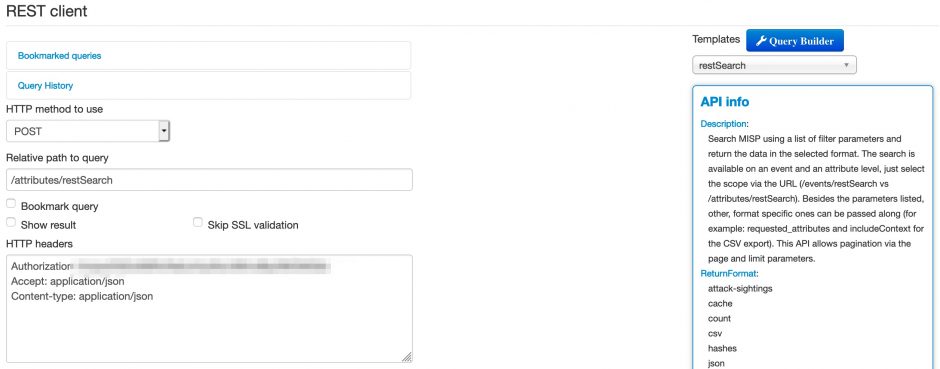
MISP includes a powerful REST API that allows you to automate the dissemination of threat intelligence and threat data. If you aren’t familiar with the API you can explore its features (and the inline documentation) via Event Actions, REST client.
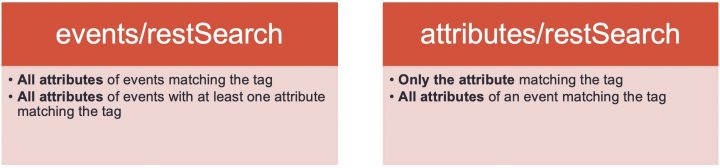
One thing that is sometimes confusing is the difference in results between searching for events and searching for attributes. Hence this small overview.
Searching for events is done via the endpoint events/restSearch. Now if you search for events with tag XYZ then
Searching for attributes is done via the endpoint attributes/restSearch. If you search for attributes with tag XYZ then
Apart from the tags, there are some other useful selection criteria that you can apply, such as
For reference, if you prefer to try out these queries via the command line you can also use this Curl command (which actually queries for the items classified as phishing):
curl -k \
 -d '{"returnFormat":"csv","tags":"rsit:fraud=\"phishing\""}' \
 -H "Authorization: API-KEY" \
 -H "Accept: application/json" \
 -H "Content-type: application/json" \
 -X POST https://MISP-URL/attributes/restSearch
Additional information is available via the MISP automation documentation.
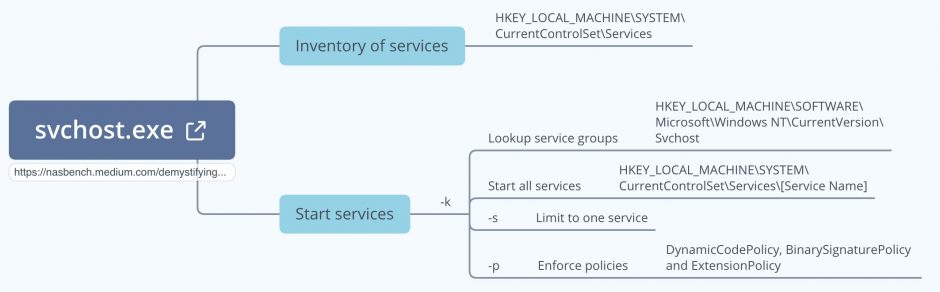
Nasreddine Bencherchali published an article on Demystifying the “SVCHOST.EXE” Process and Its Command Line Options where he describes how the svchost.exe process works, the different command line flags it uses and which two registry keys are important. For my own notes I documented his article in a mindmap.
An antivirus solution is an indispensable component in your defence arsenal but it does not protect you against all threats. Complimentary to an antivirus is Loki, an open-source IOC scanner. Loki is a scanner that allows you to search for intrusion activity such as
The most common use case is a “Triage” or “APT Scan” scenario in which you scan all your machines to identify threats that haven’t been detected by common antivirus solutions. What makes Loki different to common antivirus solutions is that you can provide it your own set of detection rules. Why is this important? Organisations such as ICS CERT, Kaspersky ICS CERT and ESET publish on regular basis detection rules. In addition to this, if you are part of a threat sharing group (fe. see MISP communities) you receive frequent updates on the new threats targeting your sector. You can leverage this information with Loki to hunt for malicious activity. Loki supports
YARA rules are a flexible way to detect various types of -malicious- activity by combining detection elements with some logic.
My use case was
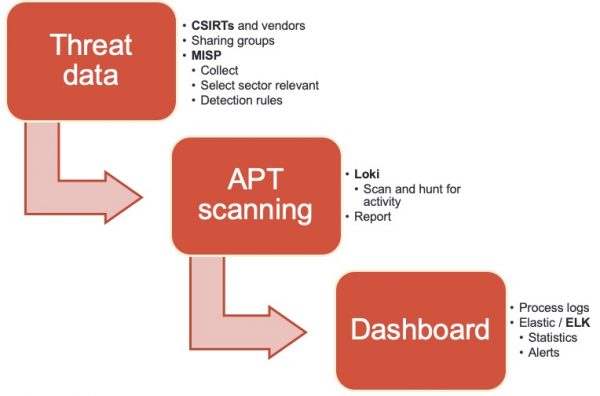
The easiest way to collect threat data is by setting up MISP, an Open Source Threat Intelligence Platform and connecting your instance with those of CSIRTs, vendors and threat sharing groups. The next step is to extract the data from MISP and make it available in a format that can be used by Loki. The signatures of Loki are provided via a separate Github repository, which also allows contains tooling to fetch threat data from MISP. Unfortunately, the connector was outdated and didn’t support MISP warning lists (lists of well-known indicators that can be associated to potential false positives, errors or mistakes) or selection of threat data based on a taxonomy (fe. via MISP tagging). I submitted a pull request with a new version of get-misp-iocs.py.
Using the threat connector is easy
/var/www/MISP/venv/bin/python3 ./get-misp-iocs.py -t '["PAP:GREEN", "Target:CIIP", "Target:ICS"]' -w 1
The above command collects threat data and writes these in the files iocs/misp-<item>-iocs.txt
When all is done, your set of custom detection rules will be available in the folder IOCS.
Loki does not require an installation and can be run directly from the command line. You do need to take some preparatory actions.
Loki requires administrator privileges to execute properly. A full system scan can take quite a while (on moderate systems, easily up to an hour).
loki.exe --reginfs --pesieveshellc
This will start Loki and have it scan for APT threat data based on your detection rules. In addition to this it will also scan for the presence of the Regin file system and attempt to detect shell code (memory regions that are not a part of any module, but contain executable code). Loki stores its output in a text log file in the directory where it was executed (you can change this with the option –logfolder). Loki also supports export to CSV (option –csv) but for the further process I’ll use the default log format.
Once Loki has finished scanning and you have collected the individual log files you can process and present them in an easy accessible format. I use the Elastic stack and rely on a previous project for analysing Linux logs : a setup of an Elastic DFIR cluster.
The cluster configuration contains an updated Logstash configuration file to process Loki log files and a patterns file for the timestamp. The docker-compose file is also changed to make the patterns directory available for the Logstash docker containers.
Importing the log files can be done by first copying the log files in the directory logs and then by running Filebeat from the ~/elastic-dfir-cluster directory.
docker run -d --net=elastic-dfir-cluster_elastic --name=filebeat --volume="$(pwd)/filebeat/filebeat.docker.yml:/usr/share/filebeat/filebeat.yml:ro" --volume="$(pwd)/logs:/volume/:ro" -e -strict.perms=false docker.elastic.co/beats/filebeat:7.9.2 filebeat
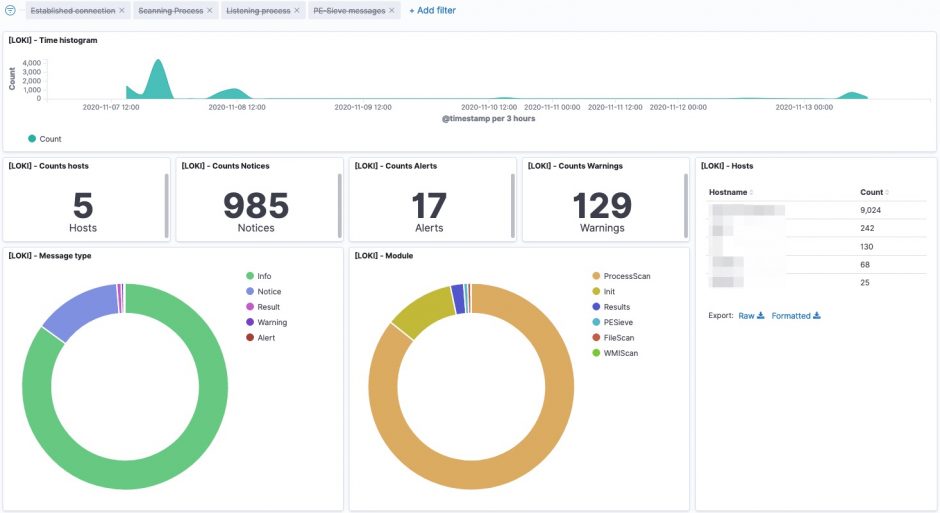
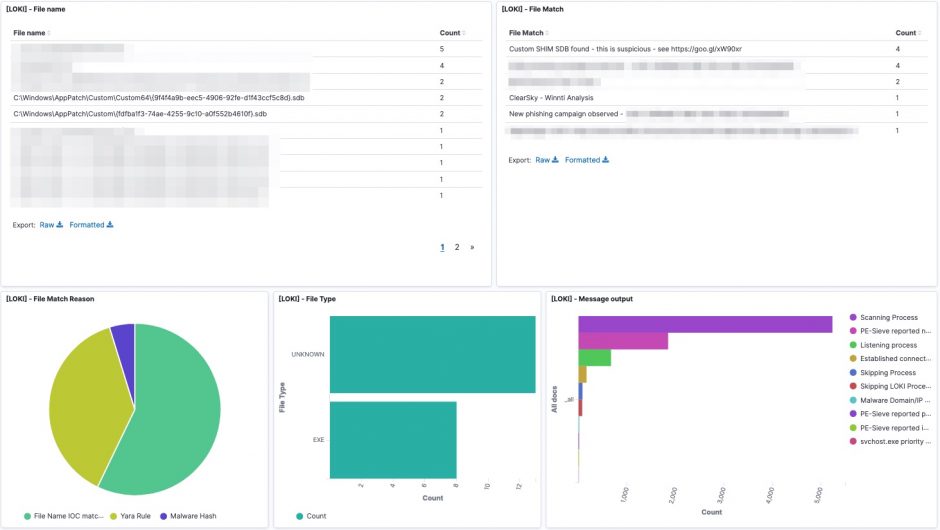
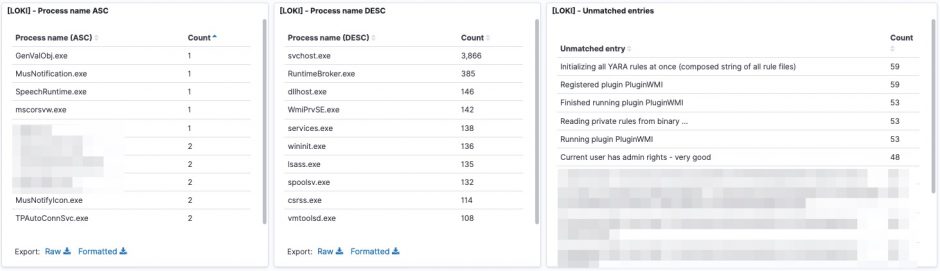
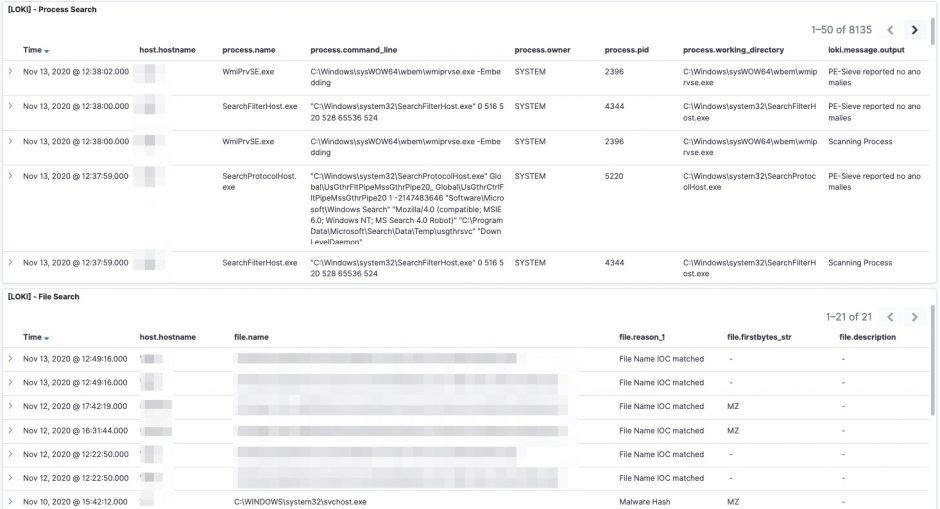
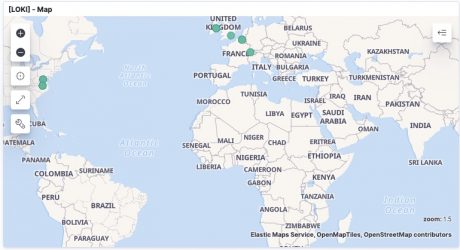
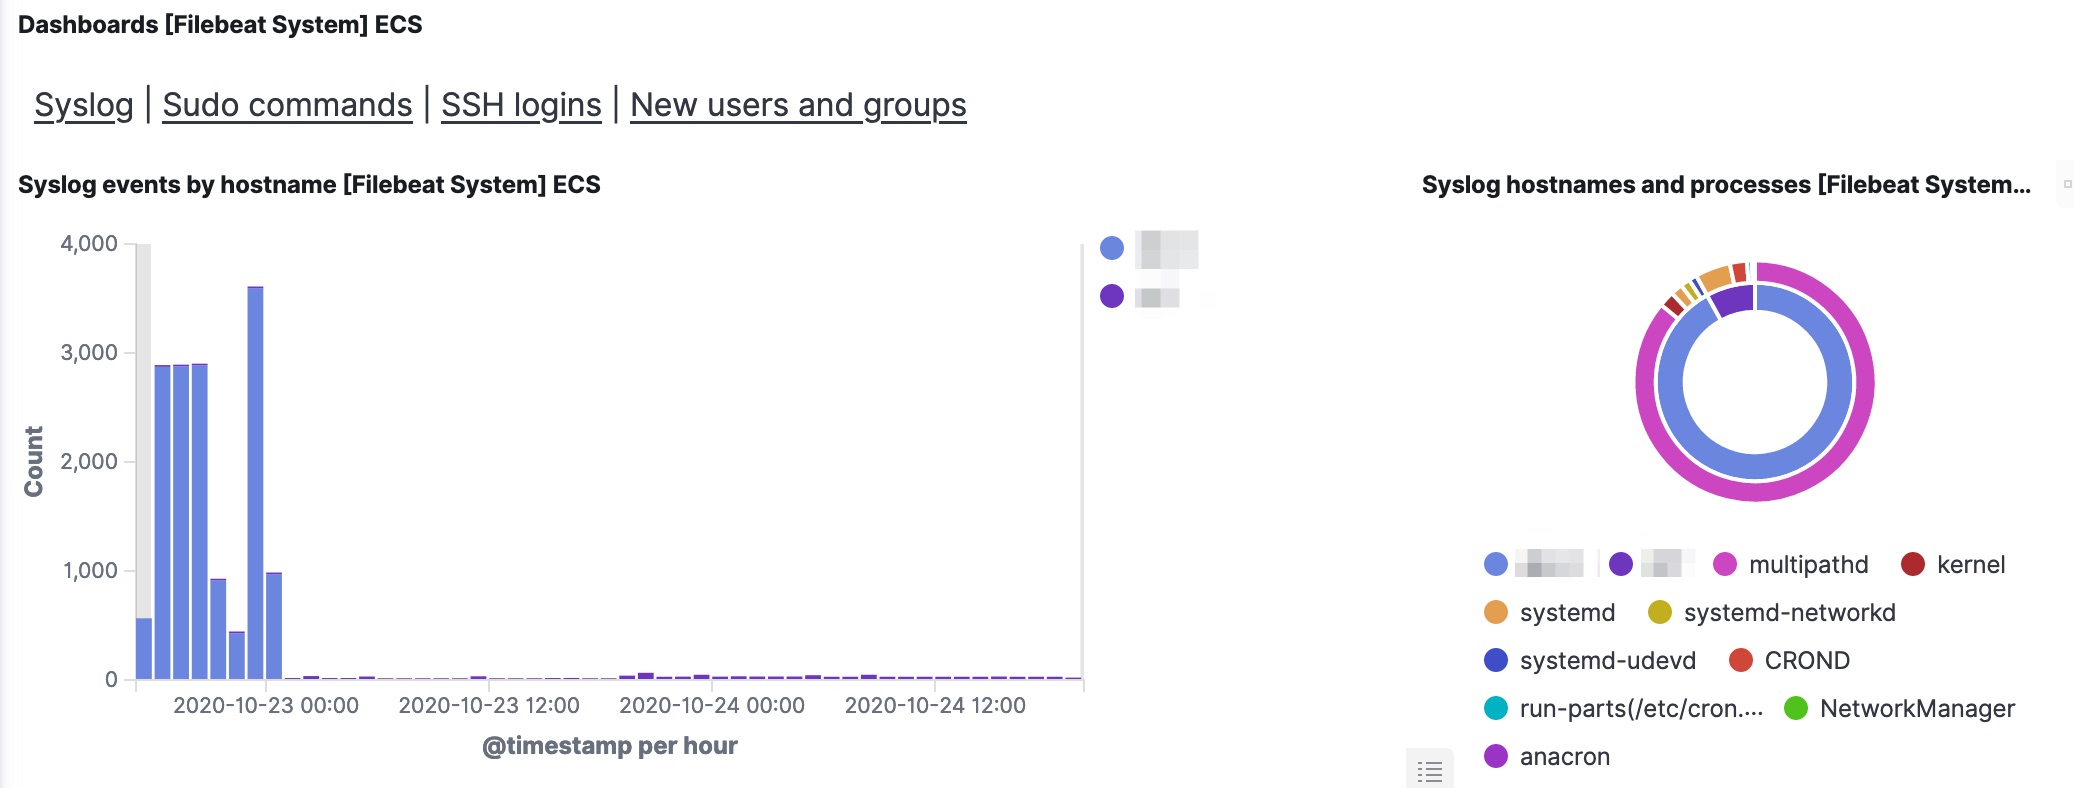
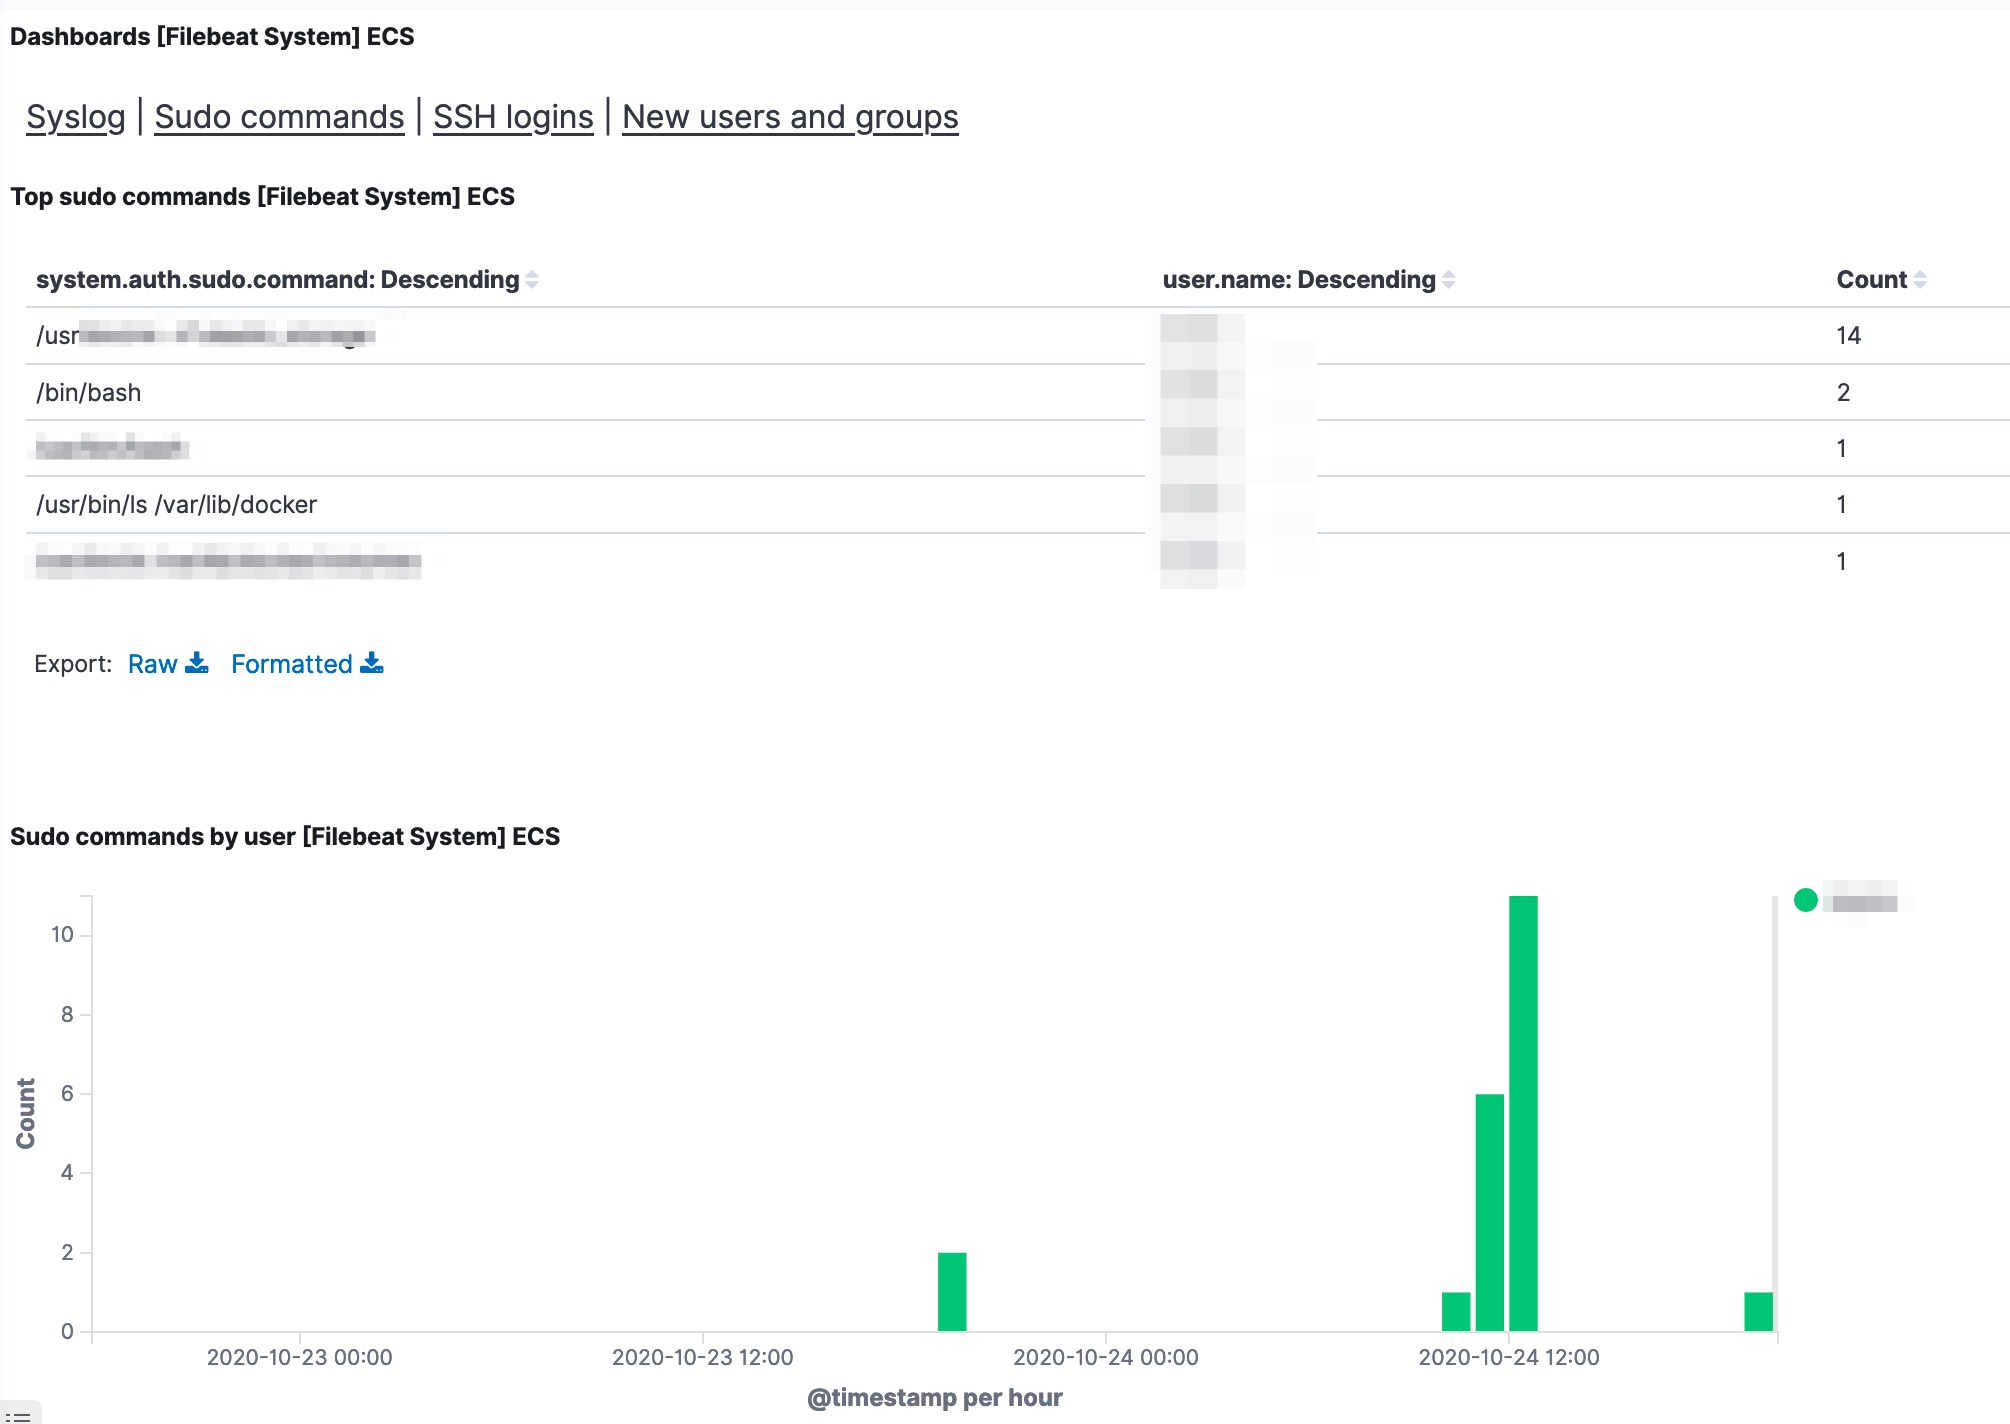
The logs are available in Kibana once Logstash has finished processing them all. I created a number of dashboards and visualisations that you can use as inspiration to set up your own dashboards. One of the extra outcomes of this approach is that the processing of the Loki log files gives you a detailed view on
UPDATE 20201114: I added an export of the Kibana dashboard in the Github repository. You can import this dashboard directly to get visualisations as the ones below.
curl -X POST "<hostname>:5601/api/kibana/dashboards/import" -H 'kbn-xsrf: true' -H 'Content-Type: application/json' -d'
... paste here everything from loki-dashboard.json
'
Some of the features from Loki are also available via EDR tools to detect and respond to security incidents. However not all organisations have an EDR tools and they are certainly very rare in isolated (not connected to the Internet) environments.
One of the nice things of working in infosec is that there is always a new tool available to make your work easier. It can also cause a lot of frustration, as there is yet another new tool that you need to master. A tool I recently discovered is Watcher, a platform for discovering new cybersecurity threats targeting your organisation. Some of its key features include
As I’m already using the AIL framework I was interested to see if Watcher is complimentary or could replace AIL. My use case is pretty straightforward. For a number of organisations (in fact keywords relevant for organisation asset descriptions) I want to receive notifications if
I created my own tooling (Digital Footprint Light) for the first two cases and I’m using AIL to cover the third. For the new domains I use dnstwist with manual post-processing. Based on its feature list, Watcher might be an answer to both my third and fourth case. Hence a walkthrough of Watcher.
Watcher is available as a Docker instance, which makes it very easy to evaluate. Clone the Github directory and make sure you have Docker and Docker Compose installed. Before starting the Docker containers, edit the .env file. This file also allows you to configure the integration with TheHive and MISP.
TZ=timezone
DJANGO_SECRET_KEY=the secret key
ALLOWED_HOST=set this to the FQDN of your server
After these changes you can start the containers with
docker-compose up
If succesfull, create an admin user and populate your database, as described in the installation notes.
The start page of Watcher presents you a tag-cloud of trending topics. Note that the tag cloud will only contain relevant information after running Watcher for a couple of hours.
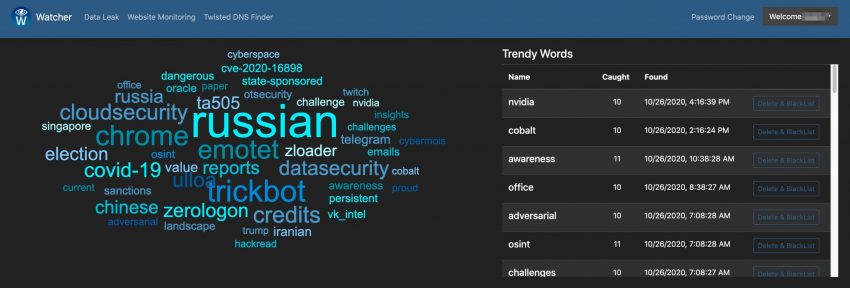
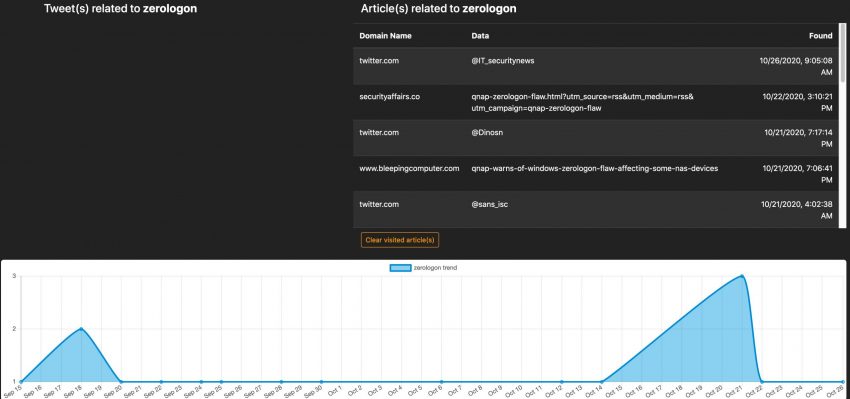
The tag cloud is based on the monitoring of a set of sources, defined in the administration interface.
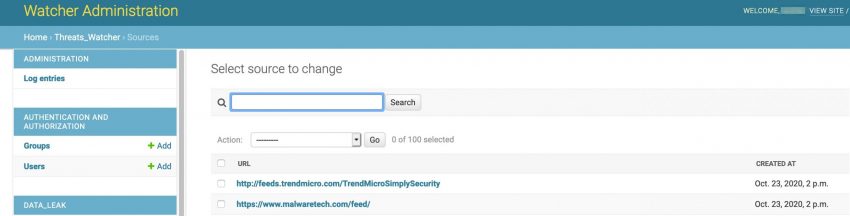
The tag cloud and user interface for the trend monitoring is very simple and easy to use but the quality of the monitoring entirely depends on the sources that you provide it. This feature can prove very valuable if you want to watch a limited set of websites for new topics, but it’s maybe less useful for a more ‘global’ trend watching. Out of the box Watcher includes more than 100 sources.
The second option is monitoring for potential data (or information) leaks. You have to provide a number of keywords in which you’re interested and then Watcher will alert you if a hit is found. Apart from the web interface, Watcher can also send you e-mail notifications.
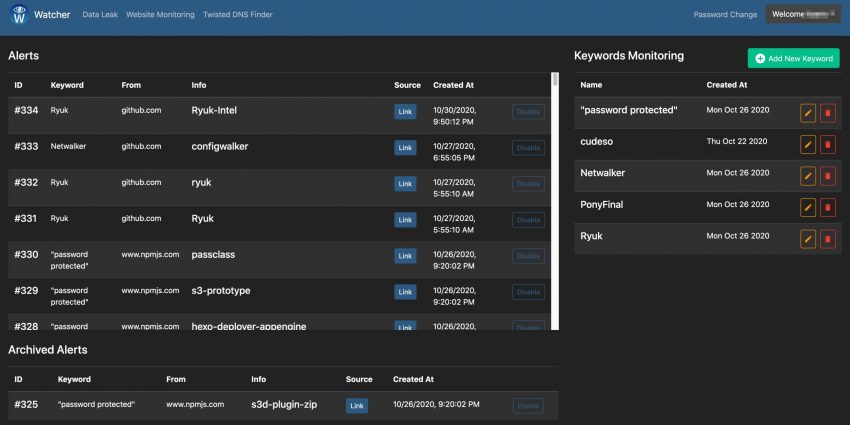
In the background Watcher uses a Docker image of Searx, a privacy-respecting, hackable metasearch engine. The straightforward user interface of Watcher allow you to easily add new terms, but it does not have additional filtering (for example exclude specific combinations). In order to use Watcher Pastebin API feature, you need to subscribe to a Pastebin pro account and whitelist the Watcher public IP.
The third feature in Watcher is monitoring websites for changes. These changes can either be on the website itself, a change in the IP address or a change in the e-mail records. When you add the website, you can give an RTIR ticket number as reference.
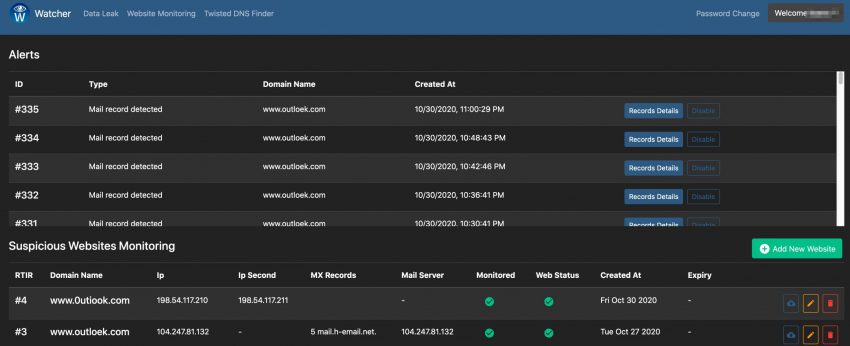
The last feature is a graphical layer on top of Dnstwist. Dnstwist allows you to discover permutations of domainnames, ideal to spot cybersquatting. As before, Watcher makes it easy to add new domains to monitor.
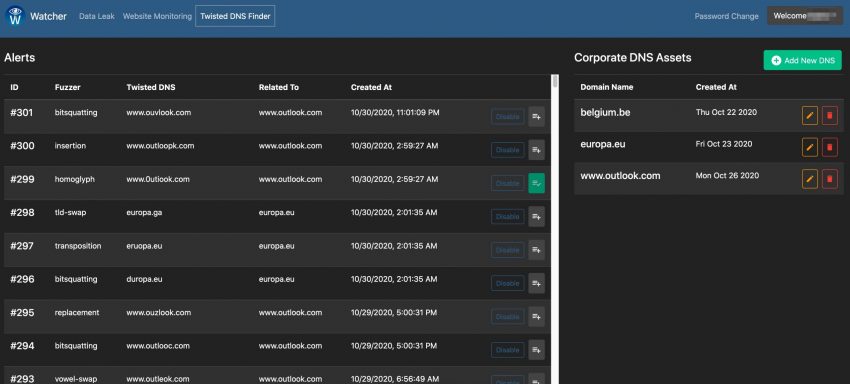
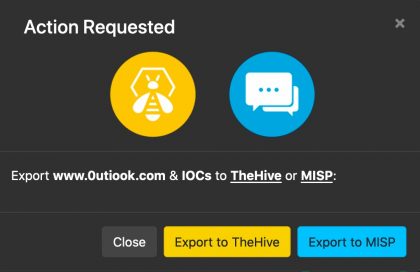
During this walkthrough of watcher, I found the user interface and the ease of use of Watcher very good, it is very easy to add an item you’d like to have monitored. I very much like to web interface around the Dnstwist feature. In some cases having the domain monitored is a very valid solution, in other cases I’d like to report this directly to TheHive/MISP (see: Issue 16). The website monitoring is certainly useful but has room for improvement. For example monitoring changes in the web server environment (see: issue 17) or included libraries would be an interesting addition. Partially this can be covered by integrating with services such as Urlscan.io. And finally, compared to the AIL framework, the leak detection options are limited. This shouldn’t be a problem as such (also see AIL integration) but it still does require running multiple tools.
I’m now primarily using the website monitoring and twisted dns features of Watcher, pending the further integration with the AIL framework.
The Elastic stack is a great tool to quickly visualise large volumes of log files. In a previous post I described how to load stored Windows EVTX logs in Security Onion, with the help of Winlogbeat. In this new post I describe something similar with the goal to analyse Linux auditd logs with Elastic. Instead of using the Elastic stack of Security Onion I use an Elastic cluster via Docker and instead of storing the Windows EVTX files, I now store traditional Linux log files such as syslog, cron and auditd in Elastic. For the shipment of the logs I’ll be using Filebeat, instead of Winlogbeat.
The first step is to deploy an Elastic cluster with Docker. I created a Github repository with all the necessary files: elastic-dfir-cluster. Make sure you have Docker and Docker-compose installed, clone the repository and you’re ready to go.
git clone https://github.com/cudeso/elastic-dfir-cluster.git
The key configuration is in the Docker compose file docker-compose.yml. This will start 2 Elasticsearch nodes, one Logstash node and one Kibana node. The data is stored as a local volume. If your machine is sufficiently powerful, you can add extra Elasticsearch nodes in the configuration.
First you have to init the cluster to remove any remaining old volumes and networks. When this is done, start the cluster. Both init and start are handled with bash scripts.
./init-elastic-dfir.sh
Removing kibana        ... done
Removing logstash      ... done
Removing elasticdfir02 ... done
Removing elasticdfir01 ... done
Removing network elastic_elastic
elastic_data01
elastic_data02
WARNING! This will remove all custom networks not used by at least one container.
Are you sure you want to continue? [y/N] y
WARNING! This will remove all local volumes not used by at least one container.
Are you sure you want to continue? [y/N] y
./start-elastic-dfir.sh
There is a screen on:
	215088.elastic_dfir	(10/24/20 16:45:46)	(Detached)
1 Socket in /run/screen/S-dfir.
The containers are started in a screen, to allow you to periodically review the status of the cluster. Just attach to the screen. Alternatively, you can also dump the container logs.
screen -r elastic_dfir
Filebeat is a log shipper, similar to Winlogbeat. Where Winlogbeat is specific for Windows event logs, Filebeat can ship almost any log you can think of. For this post, I use Filebeat via Docker. There are two things to do to get Filebeat working:
All the required configuration is in filebeat/filebeat.docker.yml and uses Filebeat modules. This makes it easier to directly have the correct field matchings of data in the log file and the storage in Elastic, and doesn’t require you to write your own Logstash log parser (grok!). The configuration enables the modules auditd, system and iptables. The system module supports syslog and authentication files. In summary, this config allows you to process:
filebeat.config.modules:
  enabled: true
  path: /modules.d/*.yml


filebeat.modules:
- module: auditd
  log:
    enabled: true
    var.paths: ["/volume/audit*"]
    exclude_files: ['\.gz$']

- module: system
  syslog:
    enabled: true
    var.paths: ["/volume/syslog*", "/volume/messages*", "/volume/cron*"]
    exclude_files: ['\.gz$']
  auth:
    enabled: true
    var.paths: ["/volume/auth.log*", "/volume/secure*"]
    exclude_files: ['\.gz$']

- module: iptables
  log:
    enabled: false
    var.paths: ["/volume/iptables.log*"]
    var.input: "file"
    exclude_files: ['\.gz$']

output.elasticsearch:
  hosts: ["elasticdfir01:9200"]

setup.kibana:
  host: "kibana:5601"
The only important thing to remember is that the log files you want to process need to be stored in the directory ‘logs’. This directory needs to exist in the folder where docker-compose was executed. In most circumstances this will be the folder that you used to clone the repository (elastic-dfir-cluster).
mkdir elastic-dfir-cluster/logs
Once you have the log files in the correct location, start the container with
docker run -d --net=elastic_elastic --name=filebeat --volume="$(pwd)/filebeat/filebeat.docker.yml:/usr/share/filebeat/filebeat.yml:ro" --volume="/home/dfir/elastic/logs/:/volume/:ro" -e -strict.perms=false docker.elastic.co/beats/filebeat:7.9.2 filebeat
While the Elastic stack is processing the log files, you can continue with the second step: create the dashboards and visualisations. You don’t have to create them from scratch, Filebeat can do the bulk of the work for you.
docker exec -it filebeat sh -c "/usr/share/filebeat/filebeat setup -e"
Filebeat will greet you with a message when all is done.
2020-10-24T17:34:45.197Z	INFO	eslegclient/connection.go:99	elasticsearch url: http://elasticdfir01:9200
2020-10-24T17:34:45.199Z	INFO	[esclientleg]	eslegclient/connection.go:314	Attempting to connect to Elasticsearch version 7.9.2
2020-10-24T17:34:45.199Z	INFO	cfgfile/reload.go:262	Loading of config files completed.
2020-10-24T17:34:45.871Z	INFO	fileset/pipelines.go:139	Elasticsearch pipeline with ID 'filebeat-7.9.2-system-auth-pipeline' loaded
2020-10-24T17:34:46.014Z	INFO	fileset/pipelines.go:139	Elasticsearch pipeline with ID 'filebeat-7.9.2-system-syslog-pipeline' loaded
2020-10-24T17:34:46.428Z	INFO	fileset/pipelines.go:139	Elasticsearch pipeline with ID 'filebeat-7.9.2-auditd-log-pipeline' loaded
Note that in some circumstances, Filebeat will not immediately ingest the logs. If this is the case, you can restart the processing of the log files by restarting the container.
docker stop filebeat ; docker rm filebeat
docker run -d --net=elastic_elastic --name=filebeat --volume="$(pwd)/filebeat/filebeat.docker.yml:/usr/share/filebeat/filebeat.yml:ro" --volume="/home/dfir/elastic/logs/:/volume/:ro" -e -strict.perms=false docker.elastic.co/beats/filebeat:7.9.2 filebeat
If all worked out fine, you’ll now have a couple of dashboards available in Kibana.
Apart from the traditional Linux log files, my objective was to analyse auditd logs with elastic. The module is already enabled in Filebeat, there are just a few additional steps to take.
Auditd provides a very good visibility for Linux system activity, but in order to track the launch of every process you need to tweak the auditd config a bit. As described by secopsmonkey, add a file /etc/audit/rules.d/10-procmon.rules with these lines
-a exit,always -F arch=b64 -S execve -k procmon
-a exit,always -F arch=b32 -S execve -k procmon
Then restart the auditd service. If you can’t restart the auditd service, then check that the systemd script allows manual restarts. In /etc/systemd/system/multi-user.target.wants/auditd.service, RefuseManualStop should be commented.
...
#RefuseManualStop=yes
...

systemctl restart auditd.service
Now there’s one final change you need to do. The Filebeat auditd module transforms the event.action (in fact, the action logged by auditd) to lowercase. In /usr/share/filebeat/module/auditd/log/ingest/pipeline.yml you’ll notice
- lowercase:
    ignore_failure: true
    field: event.action
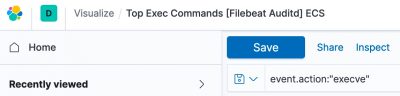
Unfortunately the dashboard for auditd doesn’t take this transform to lower case into account. But there’s a fix. Open the visualisation Top Exec Commands [Filebeat Auditd] ECS. In the top bar you’ll see a filter for EXECVE. Change this to “execve”. Then click Save (and make sure that the checkbox next to ‘Save as new visualization’ is not enabled).
Note that if this change doesn’t work the first time, then first refresh the Kibana field list (Stack Management, Index Patterns) and try again.
Now head to the auditd dashboard. If all went well, all visualisations should contain data.
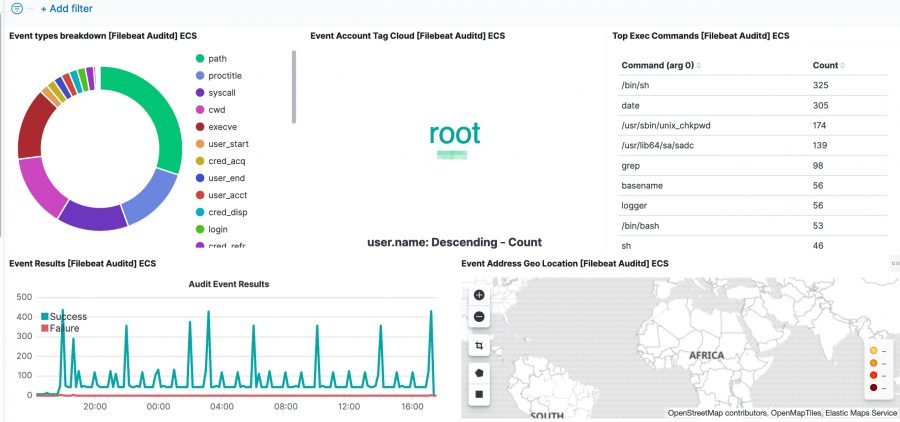
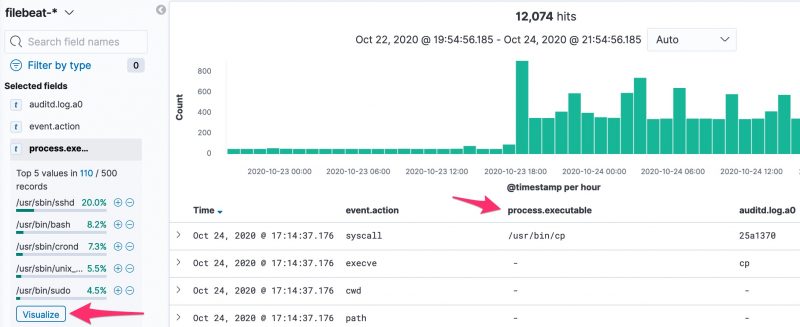
The Kibana dashboard(s) gives you an initial overview what’s happening on your system. But there’s more. The tracking of process execution will not log the user who just executed the process (execve), this information is stored in another log line (the syscall entry). To get this information you have to use the raw data, via Discover.
For example, in the initial dashboard there is a notice that wget is used.
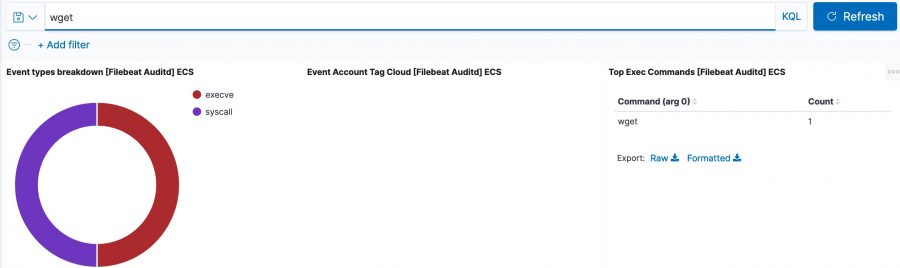
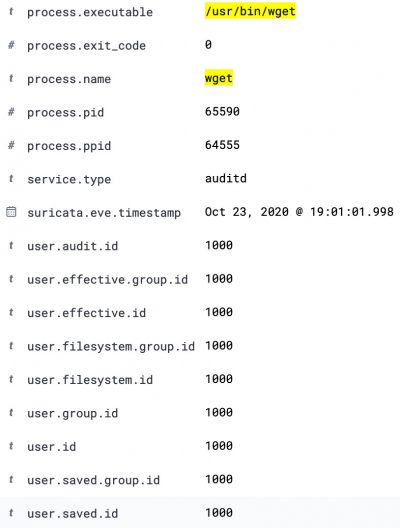
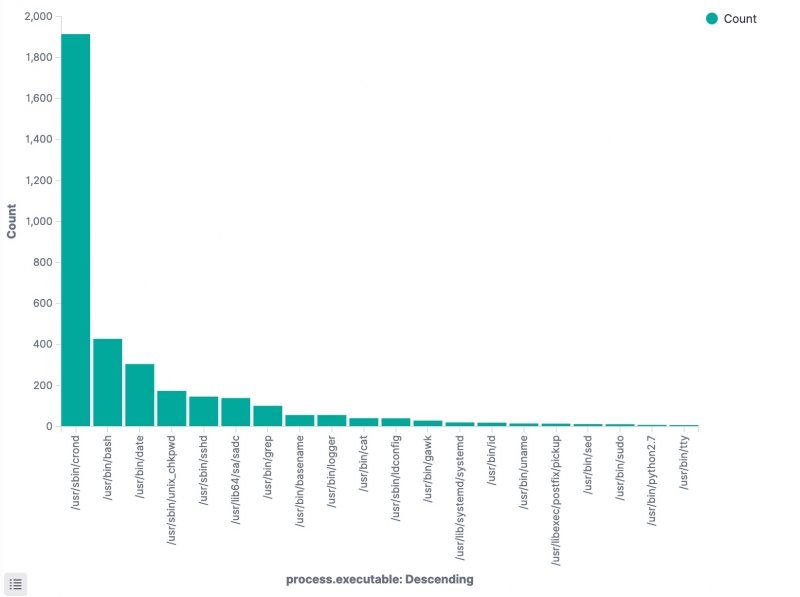
Apart from the method above, there’s another interesting option to track which processes have been executed. In the Discover section of Kibana, add process.executable as one of the columns to display. The field list on the left has a button Visualize, which provides you direct access to visually represent all the process executions.
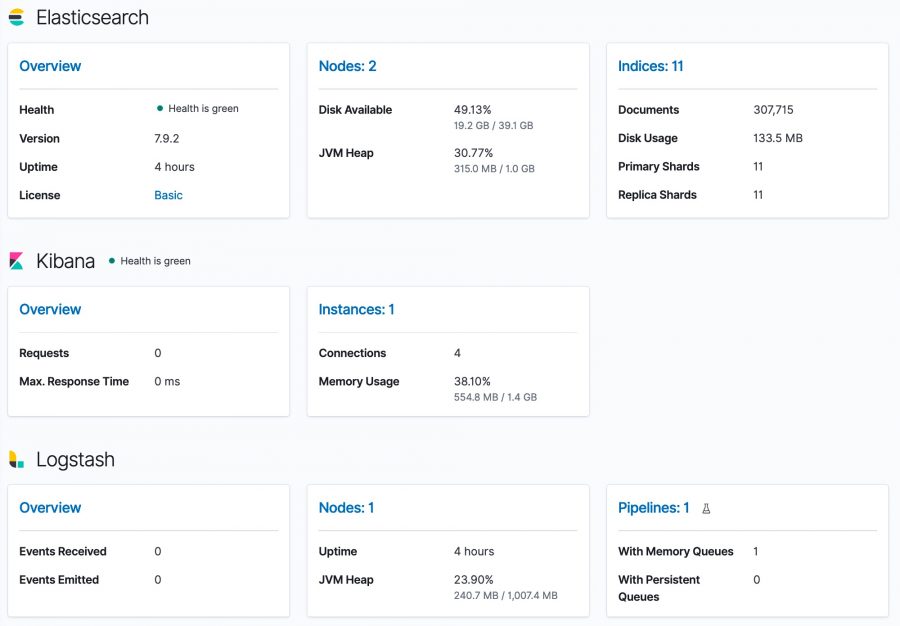
Optionally you can also install Stack Monitoring to monitor the statistics and health of the Elastic stack. Under the Management menu, choose Stack Monitoring and then choose self monitoring.
I published an article on the IBM Security Intelligence blog : Incident Response: 5 Steps to Prevent False Positives. The article describes how false positives look like and how they can interfere with your incident response and threat intelligence processes.
I propose 5 steps to prevent false positives, including
I published a post on the misp-project website on MISP service monitoring with Cacti.
The post covers how to use Cacti to monitor the performance and well-functioning of a MISP server. This includes


Graphs made with cudeso posts stats
By continuing to use the site, you agree to the use of cookies. more information
An HTTP cookie, is a small piece of text sent from a website and stored in your web browser. Cookies are a reliable mechanism for websites to remember your preferences and improve your browsing experience.
If you continue to use this website without changing your cookie settings or you click "Accept" below then you are consenting to this.