Do Tor exit nodes alter your content? (or is Tor safer than Vodafone?)

Do Tor exit nodes alter your content?

The short answer : no, TOR exit nodes do not alter your content.

A recent post by @adrellias got my attention.


Twitter @adrellias

The link in the post refers to an article where a user spots a case of content (Javascript) injection by Vodafone. The details can be found in the blogpost Am I hacked? Oh, it’s just Vodafone. Needless to say this is very bad behavior by Vodafone.

Vodafone eavesdrops on your conversation, causing this to be a privacy issue. Also, the methodology used by Vodafone leads to a dangerous attack vector. If someone finds a way to alter the injected code this could lead to for example mass distribution of unwanted content, even malware.

Remember TalkTalk? ISPs are also targets of attackers.

The author of that post concludes with “In a little while we’ll all be on Tor.”.

I wanted to check if something similar happens on the Tor network. I wanted to verify if Tor exit nodes alter the HTML content.

Some remarks if you consider using Tor for daily, frequent internet use :

  • You do not control, neither can easily identify who manages the end-point. It would be a very bad idea to transmit credentials through the Tor network;
  • You have no control over the chosen end-point;
  • Similarly, you do not know who looks at your traffic. This can also be a privacy issue. See the Tor documentation. You can also refer to the Tor Legal FAQ : “Do not examine anyone’s communications without first talking to a lawyer.”;
  • Even if you use encryption, you have to be prudent to use Tor for accessing your bank account, I personally don’t use Tor for banking transactions. The transmission might be encrypted but you have to make sure that your requests go to the intended resource ;
  • My test covers only a subset of all of the available Tor exit nodes.

Interested in the graphs? Scroll down to Mapping the Tor exit nodes.

The Tor network

Tor protects you by bouncing your communications around a distributed network of relays run by volunteers all around the world: it prevents somebody watching your Internet connection from learning what sites you visit, and it prevents the sites you visit from learning your physical location (from https://www.torproject.org/).

I posted on the use of Tor before

The setup

Goal

The basic goal was to

  1. Setup a web page on a web server.
  2. Retrieve that web page through a Tor proxy connection.
  3. Obtain a new IP through Tor (basically getting a new identity).
  4. Retrieving the same HTML file.
  5. Then comparing the output.

Proxy and Tor setup

For this test I used my previously described setup with Privoxy and Tor on an Ubuntu system.

Test web page

The test web page was stored on a cloud hosted machine. I included some content that would make it more enticing for an intruder to look at the content. The page contained

  • meta data from Bank of America, Banco Bradesco and BNP Paribas Fortis;
  • a login form from Bank of America and Banco Bradesco;
  • some keywords referring to adult content


HTML page

Retrieve the web page

I then wrote a short bash script that restarts the Tor service (getting a new IP, there are better ways to accomplish this but it worked), sleeps a while (to make sure the Tor tunnel is started) and then retrieves the page. I used a fake user agent for more cloaking. Once the web page was retrieved I used curl to obtain the IP address of the Tor node.

This last step basically gives away that this is “unusual” internet-behavior (normally you do not use curl to get a web page). But because the HTML content was already downloaded I did not really care about this.

#!/bin/bash

export http_proxy="http://127.0.0.1:8118"

for (( ; ; ))
do
   sudo /etc/init.d/tor restart
   sleep 15
   FNAME=`hexdump -n 16 -v -e '/1 "%02X"' /dev/urandom`

   wget -a torget.log --inet4-only --no-cache --user-agent="Mozilla/5.0 (Windows NT 6.1; WOW64; rv:42.0) Gecko/20100101 Firefox/42.0" -O $FNAME http://REDACTED/mytrpt.html
   curl -s http://ifcfg.me |cut -d " " -f 5 > $FNAME.ip   
   sleep 3
done

The above resulted for every retrieval in two files : one file containing the HTML and one file (ending in .ip) containing the IP address.

I had this script run for a couple of hours and then had a look at the results.

Analyze the results

Scripting the hash

I wrote a second bash script to analyze the retrieved files. It removed all files with no content (size 0, this can be the result of for example an unavailable exit node), calculated the MD5 hash and then looked at how many unique MD5 hashes occurred.

#!/bin/bash

echo "Delete HTML files that return empty"
EMPTYFILES=$(ls -l | grep " 0 Dec" |grep -v .ip| awk '{print $9}')
for F in $EMPTYFILES
do
 rm $F
 rm $F.ip
done

echo "Delete HTML files that have no IP (curl-error?)"
EMPTYFILES=$(ls -l | grep " 0 Dec" |grep .ip| awk '{print $9}'| cut -d \. -f 1)
for F in $EMPTYFILES
do
 rm $F
 rm $F.ip
done

# Can do md5sum for a dir but more difficult to get only md5 on HTMLfiles
echo > md5sum.log
HTMLFILES=$(ls -l |  grep -v .ip | grep -v .sh | grep -v .log | awk '{print $9}')

echo "Running MD5"
for f in $HTMLFILES
do
 md5=`md5sum $f | awk '{print $1}'`
 echo $md5 >> md5sum.log
done

echo "Counting elements"
cat md5sum.log | grep . | wc -l

echo "Unique elements"
cat md5sum.log | grep . | sort | uniq | wc -l
echo "->"
cat md5sum.log | grep . | sort | uniq

Results

In total the HTML page was completely (meaning not empty) returned for a total of 1568 times. The resulting md5sum.log file had 1 unique entry.

Counting elements
1568
Unique elements
1
->
bda6944a104b0854b7c15a1906d7fdd5

Because all of the returned HTML content was identical the conclusion is that, at least for a basic HTML page, the Tor exit nodes do not alter the returned content.

This does not mean it does NOT happen. I only looked at a subset of exit nodes. The Tor Metrics page gives an overview of running Tor nodes. You can download the IP-list via http://torstatus.blutmagie.de/. My test also consisted of retrieving a single HTML page on a test domain. Pages coming from popular sources might render different results.

Mapping the Tor exit nodes

Because the test already gave me a list of Tor exit nodes I decided I could as well graph these results. I used a third script to run through the *.ip files, extract the IPs and enrich the file with info from Team Cymru. The request for the IP (via curl) failed on a couple of occasions, this resulted in HTML being present in the *.ip files. I detected these via the head-tag and removed these files from the results.

#!/bin/bash

echo "Remove IPs with Proxy errors"
HTMLIP=$(fgrep "<head>" *.ip | cut -d \: -f 1)
for f in $HTMLIP
do
 rm $f
done

echo "Extract IPs"
IPFILES=$(ls *.ip)
echo > ip.log
echo > ip.uniq.whois.log
echo "begin" > ip.uniq.log
echo "verbose" >> ip.uniq.log
for f in $IPFILES
do
 `cat $f >> ip.log`
done

cat ip.log | sort | uniq | wc -l
cat ip.log | sort | uniq >> ip.uniq.log
echo "end" >> ip.uniq.log

echo "Enrich with Cymru"
cat ip.uniq.log | nc whois.cymru.com 43 > ip.uniq.whois.log

The above gives a file with unique IP addresses (ip.uniq.log) and a file with Geo-information (ip.uniq.whois.log). From the latter I can extract the countries and their occurrences with

cat ip.uniq.whois.log | awk '{print $7;}' | sort | uniq -c | sort -nr

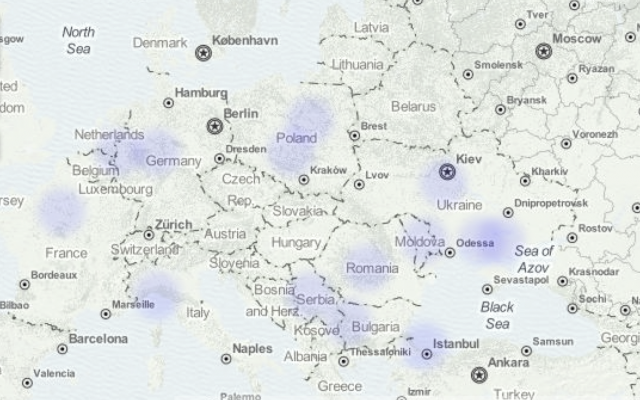
Geographic location of the Tor exit nodes

In total there were 369 unique IPs.

The majority of the Tor exit nodes is situated in the US 79 (21%), France 40 (11%), Germany 39 (11%) and Holland 36 (10%).

There were no exit nodes located in Belgium that popped up during this test.

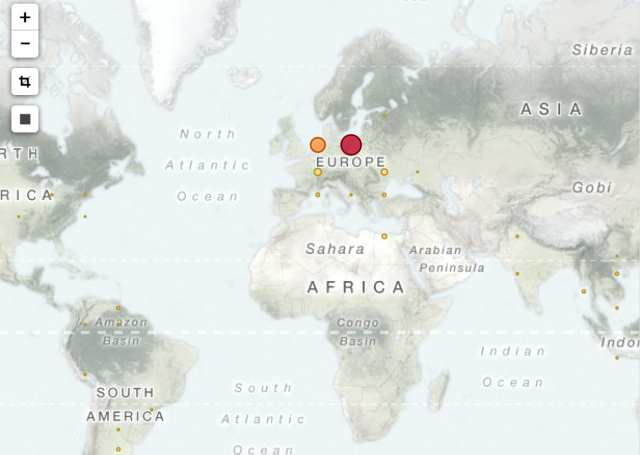
In a previous post I visualised IP data with CartoDB. I now did the same with the list of unique exit node IPs. This resulted in this map at CartoDB.

Tor exit nodes

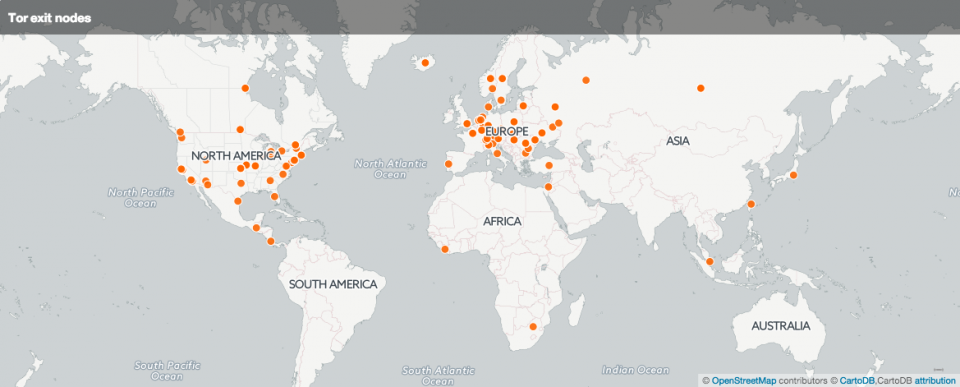
The map is published at CartoDB or (if you allow iframes) below.

Geo location differences

A word on the difference in geo location. In the data enriched via Team Cymru I had 11 IPs located in Great Britain. The CartoDB representation showed less IPs in Great Britain. Querying the IPs in CartoDB showed that the “GB”-IPs were be located in US, Mexico, Serbia and others. I do not have an explanation for the difference. Personally I put more trust in the accuracy of the data coming from Team Cymru.

Conclusion

Based on this short test it seems that Tor exit nodes do not alter the returned HTML content. It is not possible to deduct if any eavesdropping took place at the exit node.

Also this test retrieved a web page from a test domain. Pages coming from popular domains (Google, Facebook, etc.) might give different results.

Is Tor safer than Vodafone? When it concerns un-encrypted traffic you should not make a difference between how much you trust your “normal” ISP and how much you trust a Tor exit node maintainer. Neither of them should look at your content data but this does not mean they will refrain from doing so. Additionally, some Tor exit nodes are blocked (or throttled) at content delivery networks. This might negatively influence your Internet experience.

Doing open source intel with recon-ng – part 2

Recon-ng

This is the second part of a post on doing open source intel with recon-ng. The first part focused on gathering open source information for user accounts. This second part focuses on gathering domain and host information.

Finding hosts

I started with one single domain. I’m interested in what other hosts related to this domain can be found. To do this I use the search command SEARCH domains-hosts.

[recon-ng][c[u]de[s]o][hashes_org] > search domains-hosts
[*] Searching for 'domains-hosts'...

  Recon
  -----
    recon/domains-hosts/baidu_site
    recon/domains-hosts/bing_domain_api
    recon/domains-hosts/bing_domain_web
    recon/domains-hosts/brute_hosts
    recon/domains-hosts/builtwith
    recon/domains-hosts/google_site_api
    recon/domains-hosts/google_site_web
    recon/domains-hosts/netcraft
    recon/domains-hosts/shodan_hostname
    recon/domains-hosts/ssl_san
    recon/domains-hosts/vpnhunter
    recon/domains-hosts/yahoo_domain

The list shows modules that use for example Baidu, Bing and Google to get additional information. Bing and Google have both an API and web version. Ideally you stick to the API version because both Google and Bing can quickly block repeated queries. You can unlock the block by entering the correct captcha but this can be a cumbersome if you run recon-ng through a remote shell. Recon-ng will download the captcha in an image file in /tmp which you then have to copy to your host and view manually.

Baidu does not -yet- block repeated queries so this search engine is a great choice to start looking for additional information. I first start with

[recon-ng][c[u]de[s]o][hashes_org] > use recon/domains-hosts/baidu_site

[recon-ng][c[u]de[s]o][baidu_site] > run

---------
c[u]de[s]o.BE
---------
[*] URL: http://www.baidu.com/s?pn=0&wd=site%3Ac[u]de[s]o.be
[*] www.c[u]de[s]o.be
[*] linux.c[u]de[s]o.be
[*] Sleeping to avoid lockout...
[*] URL: http://www.baidu.com/s?pn=0&wd=site%3Ac[u]de[s]o.be+-site%3Awww.c[u]de[s]o.be+-site%3Alinux.c[u]de[s]o.be

-------
SUMMARY
-------
[*] 2 total (2 new) hosts found.

Because I’m starting with only one domain I will use the web version of Bing to check for extra host information (and hopefully not get locked out before getting useful results)

[recon-ng][c[u]de[s]o][baidu_site] > use recon/domains-hosts/bing_domain_web

[recon-ng][c[u]de[s]o][bing_domain_web] > run

---------
c[u]de[s]o.BE
---------
[*] URL: https://www.bing.com/search?first=0&q=domain%3Ac[u]de[s]o.be
[*] www.c[u]de[s]o.be
[*] solution.c[u]de[s]o.be
[*] Sleeping to avoid lockout...
[*] URL: https://www.bing.com/search?first=0&q=domain%3Ac[u]de[s]o.be+-domain%3Awww.c[u]de[s]o.be+-domain%3Asolution.c[u]de[s]o.be

-------
SUMMARY
-------
[*] 2 total (1 new) hosts found.

So in total I now found three hosts related to the domain.

[recon-ng][c[u]de[s]o][bing_domain_web] > show hosts

  +-----------------------------------------------------------------------------------------------------+
  | rowid |        host        | ip_address | region | country | latitude | longitude |      module     |
  +-----------------------------------------------------------------------------------------------------+
  | 1     | www.c[u]de[s]o.be      |            |        |         |          |           | baidu_site      |
  | 2     | linux.c[u]de[s]o.be    |            |        |         |          |           | baidu_site      |
  | 3     | solution.c[u]de[s]o.be |            |        |         |          |           | bing_domain_web |
  +-----------------------------------------------------------------------------------------------------+

[*] 3 rows returned

Other modules that can give you extra hosts are for example the netcraft, shodan, vpnhunter and ssltools modules.

Resolve the hosts

I will now do a forward and reverse resolve of the hosts.

[recon-ng][c[u]de[s]o][bing_domain_web] > use recon/hosts-hosts/resolve
[recon-ng][c[u]de[s]o][resolve] > run
[*] www.c[u]de[s]o.be => 92.243.8.142
[*] linux.c[u]de[s]o.be => 92.243.8.142
[*] solution.c[u]de[s]o.be => 92.243.8.142
[recon-ng][c[u]de[s]o][resolve] > use recon/hosts-hosts/reverse_resolve
[recon-ng][c[u]de[s]o][reverse_resolve] > run
[*] 92.243.8.142 => www.c[u]de[s]o.be

-------
SUMMARY
-------
[*] 1 total (0 new) hosts found.

Starting with this IP I will use a module that queries My-IP-Neighbors.com for “near-by” IPs.

[recon-ng][c[u]de[s]o][reverse_resolve] > use recon/hosts-hosts/ip_neighbor
[recon-ng][c[u]de[s]o][ip_neighbor] > run

-------------
WWW.c[u]de[s]o.BE
-------------
[*] URL: http://www.my-ip-neighbors.com/?domain=www.c[u]de[s]o.be
[*] No additional hosts discovered at the same IP address.

---------------
LINUX.c[u]de[s]o.BE
---------------
[*] URL: http://www.my-ip-neighbors.com/?domain=linux.c[u]de[s]o.be
[*] No additional hosts discovered at the same IP address.

------------------
SOLUTION.c[u]de[s]o.BE
------------------
[*] URL: http://www.my-ip-neighbors.com/?domain=solution.c[u]de[s]o.be
[*] No additional hosts discovered at the same IP address.

No additional IPs have been found.

Vulnerability searching

Recon-ng also has support for the Google Hacking Database (GHDB) with the module ghdb. I load this module via a shortcut.

The default for loading a module is to add the full path to a module, in this case “recon/domains-vulnerabilities/ghdb”. However if the module name is uniquely identified you can load it immediately.

[recon-ng][c[u]de[s]o] > use ghdb
[recon-ng][c[u]de[s]o][ghdb] >

The module has a number of options, each representing a type of Google Dork.

[recon-ng][c[u]de[s]o][ghdb] > set
Sets module options

Usage: set <option> <value>

  Name                                 Current Value  Required  Description
  -----------------------------------  -------------  --------  -----------
  DORKS                                               no        file containing an alternate list of Google dorks
  GHDB_ADVISORIES_AND_VULNERABILITIES  False          yes       enable/disable the 1985 dorks in this category
  GHDB_ERROR_MESSAGES                  False          yes       enable/disable the 82 dorks in this category
  GHDB_FILES_CONTAINING_JUICY_INFO     False          yes       enable/disable the 343 dorks in this category
  GHDB_FILES_CONTAINING_PASSWORDS      False          yes       enable/disable the 189 dorks in this category
  GHDB_FILES_CONTAINING_USERNAMES      False          yes       enable/disable the 17 dorks in this category
  GHDB_FOOTHOLDS                       False          yes       enable/disable the 34 dorks in this category
  GHDB_NETWORK_OR_VULNERABILITY_DATA   False          yes       enable/disable the 63 dorks in this category
  GHDB_PAGES_CONTAINING_LOGIN_PORTALS  False          yes       enable/disable the 313 dorks in this category
  GHDB_SENSITIVE_DIRECTORIES           False          yes       enable/disable the 110 dorks in this category
  GHDB_SENSITIVE_ONLINE_SHOPPING_INFO  False          yes       enable/disable the 10 dorks in this category
  GHDB_VARIOUS_ONLINE_DEVICES          False          yes       enable/disable the 270 dorks in this category
  GHDB_VULNERABLE_FILES                False          yes       enable/disable the 61 dorks in this category
  GHDB_VULNERABLE_SERVERS              False          yes       enable/disable the 83 dorks in this category
  GHDB_WEB_SERVER_DETECTION            False          yes       enable/disable the 74 dorks in this category
  SOURCE                               default        yes       source of input (see 'show info' for details)

If you want to check for files containing usernames you have to enable the option GHDB_FILES_CONTAINING_USERNAMES and then run the module.

[recon-ng][c[u]de[s]o][ghdb] > set GHDB_FILES_CONTAINING_USERNAMES true
GHDB_FILES_CONTAINING_USERNAMES => true
[recon-ng][c[u]de[s]o][ghdb] > run

---------
c[u]de[s]o.BE
---------
[*] Searching Google for: site:c[u]de[s]o.be intitle:"Index of" .bash_history
[*] Searching Google for: site:c[u]de[s]o.be intitle:"Index of" .sh_history
[*] Searching Google for: site:c[u]de[s]o.be inurl:admin inurl:userlist
[*] Searching Google for: site:c[u]de[s]o.be inurl:admin filetype:asp inurl:userlist
[*] Searching Google for: site:c[u]de[s]o.be "index of" / lck
[*] Searching Google for: site:c[u]de[s]o.be index.of perform.ini
[*] Searching Google for: site:c[u]de[s]o.be inurl:php inurl:hlstats intext:"Server Username"
[*] Searching Google for: site:c[u]de[s]o.be Google for: +intext:"webalizer" +intext:"Total Usernames" +intext:"Usage Statistics for"
[*] Searching Google for: site:c[u]de[s]o.be filetype:reg reg HKEY_CURRENT_USER username
[*] Searching Google for: site:c[u]de[s]o.be filetype:reg reg +intext:"internet account manager
[*] Searching Google for: site:c[u]de[s]o.be filetype:log username putty
[*] Searching Google for: site:c[u]de[s]o.be filetype:conf inurl:proftpd.conf -sample
[*] Searching Google for: site:c[u]de[s]o.be inurl:root.asp?acs=anon
[*] /tmp/tmpbei3ow.jpg
[CAPTCHA] Answer: impwedig
[*] Searching Google for: site:c[u]de[s]o.be intext:"SteamUserPassphrase=" intext:"SteamAppUser=" -"username"  -"user"
...

As you can see in the output, when the module ran at one moment the Google queries were blocked by a captcha. After opening the jpg file and entering the code the module continued.

Reporting

Once all the modules have run you have a database with useful and interesting information. You can extract the information with SHOW DASHBOARD or SHOW CREDENTIALS but in the end it is easier to have some sort of accessible report.

Recon-ng has a number of reporting options, search for SEARCH REPORT.

[recon-ng][c[u]de[s]o][ghdb] > search report
[*] Searching for 'report'...

  Reporting
  ---------
    reporting/csv
    reporting/html
    reporting/json
    reporting/list
    reporting/pushpin
    reporting/xlsx
    reporting/xml

You can for example export your findings to a CSV format with the use of the reporting/csv module. Note that shortcut loading this module with “use csv” will not work because there are multiple modules with the same name.

[recon-ng][c[u]de[s]o][ghdb] > use csv
[*] Multiple modules match 'csv'.

  Import
  ------
    import/csv_file

  Reporting
  ---------
    reporting/csv

So this module has to been loaded with the full path.

[recon-ng][c[u]de[s]o][ghdb] > use reporting/csv
[recon-ng][c[u]de[s]o][csv] > set
Sets module options

Usage: set <option> <value>

  Name      Current Value                                        Required  Description
  --------  -------------                                        --------  -----------
  FILENAME  /home/koenv/.recon-ng/workspaces/c[u]de[s]o/results.csv  yes       path and filename for output
  TABLE     hosts                                                yes       source table of data to export

You can specify the output filename with the FILENAME option. The TABLE option describes which table has to be exported.

The CSV module will only export table by table. With the use of the HTML module you can generate a full report.

[recon-ng][c[u]de[s]o][csv] > use html
[recon-ng][c[u]de[s]o][html] > set
Sets module options

Usage: set <option> <value>

  Name      Current Value                                         Required  Description
  --------  -------------                                         --------  -----------
  CREATOR                                                         yes       creator name for the report footer
  CUSTOMER                                                        yes       customer name for the report header
  FILENAME  /home/koenv/.recon-ng/workspaces/c[u]de[s]o/results.html  yes       path and filename for report output
  SANITIZE  True                                                  yes       mask sensitive data in the report

[recon-ng][c[u]de[s]o][html] > set CREATOR Koen Van Impe
CREATOR => Koen Van Impe
[recon-ng][c[u]de[s]o][html] > set CUSTOMER c[u]de[s]o.be
CUSTOMER => c[u]de[s]o.be
[recon-ng][c[u]de[s]o][html] > run
[*] Report generated at '/home/koenv/.recon-ng/workspaces/c[u]de[s]o/results.html'.

Conclusion

Recon-ng in a penetration test

Reconnaissance is the first phase in a penetration test. Ideally (but also depending on the rules of engagement) you stay as low profile as possible to gather target information. This means that you do not directly probe any of the target systems or users and you rely on information available via different open source channels.

Recon-ng is an ideal tool to gather all of this information. Of course you can conduct the searches manually and extract the necessary information yourself. But this costs a lot of time and is cumbersome. There’s also the risk of introducing data manipulation errors. Recon-ng does all of the hard work for you.

Combining recon-ng together with the Metasploit framework makes a great tool set for doing penetration tests.

Spam protection

I use my own accounts and domain for this example but I do not have to make it to easy for spambots to index all the data. For this reason I mangled the domain name and user names in the output results in this post.

Adobe hack

Note: my account was in the 2013 Adobe account breach. I use unique passwords per site/application. These passwords are generated with a password manager and in most cases I even don’t know the password (left alone that in most cases they are impossible to remember due to their complexity). They are stored in a password vault and I export the requested password when needed. As such, the impact of the Adobe breach had little impact on any of my other accounts.

Doing open source intel with recon-ng – part 1

Recon-ng

What is recon-ng?

recon-ng is a tool for open source reconnaissance. Reconnaissance is the first phase in a penetration test and it is the act of gathering preliminary data or intelligence on your target.

Recon-ng has a look and feel similar to the Metasploit Framework and provides an easy to use interface to gather open source intelligence.

This is a post on doing open source intel with recon-ng. The post is split in two parts :


Recon-ng

Installation

The installation of recon-ng is very easy on Ubuntu Linux.

git clone https://LaNMaSteR53@bitbucket.org/LaNMaSteR53/recon-ng.git
cd recon-ng
sudo pip install -r REQUIREMENTS

This will install the latest version of recon-ng. You can then start it with

./recon-ng

How do you use recon-ng?

Open source intel with recon-ng

The best way to demonstrate recon-ng is via a use-case. In this example I will gather as much open source information as possible starting with my company domain name (c[u]de[s]o.be).

Recon-ng is highly database-driven. This means that all the operations are done starting with the information that is already available in the database.

But if you start with an empty database you need to inject a keyword somewhere to get recon-ng started …

Start with a workspace and one domain

I first start with a new workspace. This is not entirely necessary but it keeps the results cleanly contained in one single container. With the use of workspaces you can run multiple different recon operations without having the results getting mixed up with each other.

[recon-ng][default] > workspaces add c[u]de[s]o
[recon-ng][c[u]de[s]o] >

My starting point is a domain so I have to add this information manually to the database.

[recon-ng][c[u]de[s]o] > add domains c[u]de[s]o.be

[recon-ng][c[u]de[s]o] > show domains

  +----------------------------------+
  | rowid |   domain  |    module    |
  +----------------------------------+
  | 1     | c[u]de[s]o.be | user_defined |
  +----------------------------------+

[*] 1 rows returned

From domains to contacts

I now want to search for information starting with only domain information. Recon-ng has an easy way to get all the modules that can work further on domain information.

[recon-ng][c[u]de[s]o] > search domains-
[*] Searching for 'domains-'...

  Recon
  -----
    recon/domains-contacts/metacrawler
    recon/domains-contacts/pgp_search
    recon/domains-contacts/salesmaple
    recon/domains-contacts/whois_pocs
    recon/domains-credentials/pwnedlist/account_creds

By using SEARCH domains- I get everything that adds information starting from a domain. You can also use the search feature the other way around with SEARCH -domains. This will list every module that results in domain information.

I now use the PGP search module to get contact information.

[recon-ng][c[u]de[s]o] > use recon/domains-contacts/pgp_search
[recon-ng][c[u]de[s]o][pgp_search] >

Similar to the Metasploit Framework you can get the list of options with the SET command

[recon-ng][c[u]de[s]o][pgp_search] > set
Sets module options

Usage: set <option> <value>

  Name    Current Value  Required  Description
  ------  -------------  --------  -----------
  SOURCE  default        yes       source of input (see 'show info' for details)

Source option

This module has only one option, the SOURCE option. This option is something that you’ll also see in the other modules.

Remember that earlier I mentioned that recon-ng is highly database-driven. This option allows you to influence this database-driven behavior. Instead of using the database information as a starting point you can provide your own information as a starting point.

In an earlier step I added a domain manually. I could have skipped that step and used the PGP module directly, feeding it the domain manually as a source. By doing it that way however I would have lost the conceptual relationship “domain -> contacts”.

It is easy to check what information a module needs for a starting point with SHOW INFO

[recon-ng][c[u]de[s]o][pgp_search] > show info

      Name: PGP Key Owner Lookup
      Path: modules/recon/domains-contacts/pgp_search.py
    Author: Robert Frost (@frosty_1313, frosty[at]unluckyfrosty.net)

Description:
  Searches the MIT public PGP key server for email addresses of the given domain. Updates the
  'contacts' table with the results.

Options:
  Name    Current Value  Required  Description
  ------  -------------  --------  -----------
  SOURCE  default        yes       source of input (see 'show info' for details)

Source Options:
  default        SELECT DISTINCT domain FROM domains WHERE domain IS NOT NULL
  <string>       string representing a single input
  <path>         path to a file containing a list of inputs
  query <sql>    database query returning one column of inputs

Comments:
  * Inspiration from theHarvester.py by Christan Martorella: cmarorella[at]edge-seecurity.com

The information that is needed to start the crawling of the module is set in the default query string. In this case it is “SELECT DISTINCT domain FROM domains WHERE domain IS NOT NULL” meaning that it needs a domain to start with. You can change the default (database) behavior to using a string as input or also a file. The latter is very useful if you have multiple starting sources for a module (in this case for example imagine a case where you need to conduct a recon for a customer provided domain list).

Run the module and view the results

Running the module is easy with RUN

[recon-ng][c[u]de[s]o][pgp_search] > run

---------
c[u]de[s]o.BE
---------
[*] Koen Van Impe (koen.van[i]m[p]e@c[u]de[s]o.be)
[*] c[u]de[s]o sales (sales@c[u]de[s]o.be)

-------
SUMMARY
-------
[*] 2 total (2 new) contacts found.

The results will immediately be added to the database. You can have a look at the current content of the database with SHOW DASHBOARD

[recon-ng][c[u]de[s]o][pgp_search] > show dashboard

  +------------------------------------------+
  |             Activity Summary             |
  +------------------------------------------+
  |               Module              | Runs |
  +------------------------------------------+
  | recon/domains-contacts/pgp_search | 1    |
  +------------------------------------------+


  +----------------------------+
  |      Results Summary       |
  +----------------------------+
  |     Category    | Quantity |
  +----------------------------+
  | Domains         | 1        |
  | Companies       | 0        |
  | Netblocks       | 0        |
  | Locations       | 0        |
  | Vulnerabilities | 0        |
  | Ports           | 0        |
  | Hosts           | 0        |
  | Contacts        | 2        |
  | Credentials     | 0        |
  | Leaks           | 0        |
  | Pushpins        | 0        |
  | Profiles        | 0        |
  | Repositories    | 0        |
  +----------------------------+

This shows I have information on one domain and two contacts. What if I have forgotten the contact details? You can display them (along with information from the other categories) via SHOW CONTACTS

[recon-ng][c[u]de[s]o][pgp_search] > show contacts

  +-----------------------------------------------------------------------------------------------------------------------------+
  | rowid | first_name | middle_name | last_name |         email          |        title        | region | country |   module   |
  +-----------------------------------------------------------------------------------------------------------------------------+
  | 1     | Koen       | Van         | Impe      | koen.van[i]m[p]e@c[u]de[s]o.be | PGP key association |        |         | pgp_search |
  | 2     | c[u]de[s]o     |             | sales     | sales@c[u]de[s]o.be        | PGP key association |        |         | pgp_search |
  +-----------------------------------------------------------------------------------------------------------------------------+

[*] 2 rows returned

Expanding contact information

I’d now like to expand the contact information. What is available with SEARCH CONTACTS-?

[recon-ng][c[u]de[s]o][hibp_paste] > search contacts-
[*] Searching for 'contacts-'...

  Recon
  -----
    recon/contacts-contacts/mailtester
    recon/contacts-contacts/mangle
    recon/contacts-contacts/unmangle
    recon/contacts-credentials/hibp_breach
    recon/contacts-credentials/hibp_paste
    recon/contacts-credentials/pwnedlist
    recon/contacts-domains/migrate_contacts
    recon/contacts-profiles/fullcontact
 

The hibp_ modules can get me useful credential information from (previous) account breaches that is made available via https://haveibeenpwned.com/. First I want to have an overview of what breaches contain useful pointers for my search

[recon-ng][c[u]de[s]o][hibp_breach] > use     recon/contacts-credentials/hibp_breach
[recon-ng][c[u]de[s]o][hibp_breach] > run
[*] koen.van[i]m[p]e@c[u]de[s]o.be => Breach found! Seen in the Adobe breach that occurred on 2013-10-04.
[*] sales@c[u]de[s]o.be => Not Found.

-------
SUMMARY
-------
[*] 1 total (1 new) credentials found.
[*] 1 total (0 new) contacts found.

This search returns one breach (the Adobe hack) that has useful account information.

I now search for the pasties where this information was stored. These pasties sometimes can hold extra useful information. By default hibp_paste will attempt to download the pastie.

[recon-ng][c[u]de[s]o][hibp_paste] > set
Sets module options

Usage: set <option> <value>

  Name      Current Value  Required  Description
  --------  -------------  --------  -----------
  DOWNLOAD  True           yes       download pastes
  SOURCE    default        yes       source of input (see 'show info' for details)

You can disable this with the option SET DOWNLOAD False.

[recon-ng][c[u]de[s]o][hibp_breach] > use recon/contacts-credentials/hibp_paste
[recon-ng][c[u]de[s]o][hibp_paste] > run
[*] koen.van[i]m[p]e@c[u]de[s]o.be => Paste found! Seen in a Pastebin on 2014-12-08T05:12:00Z (http://pastebin.com/raw.php?i=C4b1t5Db).
[*] Paste could not be downloaded (http://pastebin.com/raw.php?i=C4b1t5Db).
[*] koen.van[i]m[p]e@c[u]de[s]o.be => Paste found! Seen in a Pastebin on 2014-12-08T04:12:00Z (http://pastebin.com/raw.php?i=h6b4BRmt).
[*] Paste could not be downloaded (http://pastebin.com/raw.php?i=h6b4BRmt).
[*] koen.van[i]m[p]e@c[u]de[s]o.be => Paste found! Seen in a Pastebin on 2014-11-26T09:11:00Z (http://pastebin.com/raw.php?i=zc3vCANP).
[*] Paste could not be downloaded (http://pastebin.com/raw.php?i=zc3vCANP).
[*] koen.van[i]m[p]e@c[u]de[s]o.be => Paste found! Seen in a Pastebin on 2014-11-25T22:11:00Z (http://pastebin.com/raw.php?i=0tbNjD4h).
[*] Paste could not be downloaded (http://pastebin.com/raw.php?i=0tbNjD4h).
[*] koen.van[i]m[p]e@c[u]de[s]o.be => Paste found! Seen in a Pastebin on 2014-11-25T13:11:00Z (http://pastebin.com/raw.php?i=Bi7mv9Kw).
[*] Paste could not be downloaded (http://pastebin.com/raw.php?i=Bi7mv9Kw).
[*] koen.van[i]m[p]e@c[u]de[s]o.be => Paste found! Seen in a Pastebin on 2014-11-25T11:11:00Z (http://pastebin.com/raw.php?i=j0kXGE6w).
[*] Paste could not be downloaded (http://pastebin.com/raw.php?i=j0kXGE6w).
[*] koen.van[i]m[p]e@c[u]de[s]o.be => Paste found! Seen in a Pastebin on 2014-11-25T01:11:00Z (http://pastebin.com/raw.php?i=c5a4bb1z).
[*] Paste could not be downloaded (http://pastebin.com/raw.php?i=c5a4bb1z).
[*] sales@c[u]de[s]o.be => Not Found.

-------
SUMMARY
-------
[*] 1 total (0 new) credentials found.
[*] 1 total (0 new) contacts found.

The module has found a couple of pasties but unfortunately they have already been deleted.

Extending the credentials

What options are available to extend the credentials? I search for the modules that can use credentials as input and output with SEARCH CREDENTIALS:

[recon-ng][c[u]de[s]o] > search credentials
[*] Searching for 'credentials'...

  Recon
  -----
    recon/contacts-credentials/hibp_breach
    recon/contacts-credentials/hibp_paste
    recon/contacts-credentials/pwnedlist
    recon/credentials-credentials/adobe
    recon/credentials-credentials/bozocrack
    recon/credentials-credentials/hashes_org
    recon/credentials-credentials/leakdb
    ...

For the purpose of this demo I assume a hash was found in a previous run. For this example I add a hash (that could for example have been found via the pasties-information) manually to a record. In order to do this I use the QUERY command

[recon-ng][c[u]de[s]o] > query update credentials set hash = '739c5b1cd5681e668f689aa66bcc254c'

[recon-ng][c[u]de[s]o] > show credentials

  +----------------------------------------------------------------------------------------------------------+
  | rowid |        username        | password |               hash               | type | leak |    module   |
  +----------------------------------------------------------------------------------------------------------+
  | 1     | koen.van[i]m[p]e@c[u]de[s]o.be |          | 739c5b1cd5681e668f689aa66bcc254c |      |      | hibp_breach |
  +----------------------------------------------------------------------------------------------------------+

[*] 1 rows returned

I’ll query https://hashes.org for matches on this hash. In order to do so I have to supply an API key.

Adding API keys for modules

Some modules will access public resources via an API and they require an API key. You have to add this API key to recon-ng with the command keys add.

[recon-ng][c[u]de[s]o] > use recon/credentials-credentials/hashes_org

[recon-ng][c[u]de[s]o][hashes_org] > keys add hashes_api replace_with_my_key
[*] Key 'hashes_api' added.

Now that an API key has been set we can use the module to extend the credential information.

[recon-ng][c[u]de[s]o][hashes_org] > run
[*] 739c5b1cd5681e668f689aa66bcc254c (MD5X5PLAIN) => test
[recon-ng][c[u]de[s]o][hashes_org] > show credentials

  +----------------------------------------------------------------------------------------------------------------+
  | rowid |        username        | password |               hash               |    type    | leak |    module   |
  +----------------------------------------------------------------------------------------------------------------+
  | 1     | koen.van[i]m[p]e@c[u]de[s]o.be | test     | 739c5b1cd5681e668f689aa66bcc254c | MD5X5PLAIN |      | hibp_breach |
  +----------------------------------------------------------------------------------------------------------------+

[*] 1 rows returned

The above command shows that a match with the hash has been found in the database of hashes.org. The matching password is automatically added to the credentials table.

Social media profiles

With the help of the module for Fullcontact I’m able to get an overview of other available social media profiles for the accounts that were previously found. Note that this module also requires an API key.

[recon-ng][c[u]de[s]o][linkedin] > use recon/contacts-profiles/fullcontact
[recon-ng][c[u]de[s]o][fullcontact] > run
[!] FrameworkException: API key 'fullcontact_api' not found. Add API keys with the 'keys add' command.
[recon-ng][c[u]de[s]o][fullcontact] > keys
add     delete  list
[recon-ng][c[u]de[s]o][fullcontact] > keys add fullcontact_api myfullcontact_api
[*] Key 'fullcontact_api' added.
[recon-ng][c[u]de[s]o][fullcontact] > run
[*] Koen Van Impe - koen.van[i]m[p]e@c[u]de[s]o.be
[*] Brugge
[*] 812988488 - Facebook (https://www.facebook.com/812988488)
[*] 1100812 - Foursquare (https://foursquare.com/user/1100812)
[*] c[u]de[s]o - Flickr (https://www.flickr.com/people/c[u]de[s]o)
[*] c[u]de[s]o - Gravatar (https://gravatar.com/c[u]de[s]o)
[*] c[u]de[s]o - Twitter (https://twitter.com/c[u]de[s]o)
[*] Confidence: 89%
[*] sales@c[u]de[s]o.be - Searched within last 24 hours. No results found for this Id.

-------
SUMMARY
-------
[*] 5 total (5 new) profiles found.
[*] 1 total (1 new) contacts found.

You can extend the profiling information for the different user accounts with other modules. Just do a search for everything that extends profiles with SEARCH profiles.

 
[recon-ng][c[u]de[s]o][profiler] > search profiles
[*] Searching for 'profiles'...

  Recon
  -----
    recon/companies-profiles/bing_linkedin
    recon/contacts-profiles/fullcontact
    recon/profiles-contacts/dev_diver
    recon/profiles-contacts/linkedin
    recon/profiles-profiles/linkedin_crawl
    recon/profiles-profiles/namechk
    recon/profiles-profiles/profiler
    recon/profiles-profiles/twitter
    recon/profiles-repositories/github_repos

End of part 1

This is the first part of a post on doing open source intel with recon-ng. This post focused on gathering open source information for user accounts. The second part on recon-ng focuses on gathering domain and host information.

Defending Against Apache Web Server DDoS Attacks

Apache Web Server DDoS Attacks

I had a post published on the IBM Security Intelligence website : Defending Against Apache Web Server DDoS Attacks. I cover the use of the modules Modsecurity, mod_evasive and Fail2ban for protecting Apache web servers.

If you’re looking for general information on how to deal with DDoS attacks then have a look at the whitepaper DDoS: Proactive and reactive measures. That document serves as a guideline, help and advice for the Belgian public and private sector to deal with DDoS attacks.

Introduction to Modbus TCP traffic

The Modbus Protocol

Modbus is a serial communication protocol. It is the most widespread used protocol within ICS.

It works in a Master / Slave mode. This means the Master has the pull the information from a Slave at regular times.

Modbus is a clear text protocol with no authentication.

Although it was initially developed for serial communication it is now often used over TCP. Other versions of Modbus (used in serial communication) are for example Modbus RTU and Modbus ASCII. For serial communication, Modbus ASCII and Modbus RTU are incompatible (meaning you have to use one or the other but not both on a network).

Every Modbus variant has to choose a frame format:

  • Modbus TCP (no checksum as lower network layers should include a checksum);
  • Modbus RTU (uses binary encoding and a CRC error check);
  • Modbus ASCII (uses ASCII characters);

You can have only one Master on a “Modbus” network and maximum 247 slaves, each with a unique slave ID. In the serial world, the devices have to been connected in a daisy-chain manner, not in a star topology.

In TCP we often refer to the Master as the Client and to the Slave as the Server.

I based my previous post with an Intro to PLCs, ICS and SCADA on a Black Hat 2014 presentation by Arnaud Soullié in a Industrial Control Systems : Pentesting PLCs 101. This post is based on the same video, together with some of my findings when I did the labs.

Modbus TCP

The TCP frame format consists of

  • Transaction identifier : to synchronize communication between devices
  • Protocol identifier : always 0 for Modbus TCP
  • Length field : identifies the remaining length of the packet
  • Unit identifier : the address of the slave (most of the time 255 because we already use the TCP/IP addresses as identifier)
  • Function code : the function to execute
    • Most functions allow to read or write data from/to a PLC
      • 3 : Read Multiple Holding Registers
      • 1 : Read Coils
      • 5 : Write Single Coil
    • Diagnostics functions
    • Some undocumented functions
  • Data bytes or command

Storing information

There are two types of places where information can be stored : coils and registers. Each of these datastore types has two different types of registers : a read/write and a read only. Each of these datastore types is a reference to a memory address.

Simply put :

  • a coil is used for storing simple booleans (1 bit). It is read/write and starts from 00001 to 09999;
  • a discrete input is a read only type for booleans, starting from 10001 to 19999;
  • an input register is a read only type for longer values (16 bits), starting from 30001 to 39999;
  • a holding register is a read/write type for longer values (16 bits), starting from 40001 to 49999;

Be aware that, depending on the hardware implementation, sometimes the registers start at 0 and sometimes they start at 1.

Unit identifiers

A word on Modbus unit devices. In most cases you don’t need a unit id because you already addressed the correct unit via its IP address. In some cases however you will run into a situation where multiple devices are connected to one IP address (for example ‘bridges’). In that case the unit id might have to be set to 255.

The unit id of 0 can be seen as a broadcast address. Messages sent to 0 can be accepted by all slaves. If you setup a Modbus client remember that it can not have unit id 0!

Modbus traffic

You can use ModbusPal to simulate the behavior of a Modbus slave. It is a Java application that allows you to play with different slaves (registers and coils). You can then query the Modbus instance with MBTGET. MBTGET is a simple modbus/TCP client write in pure Perl.

There are a couple of alternatives that you can use to play with Modbus. For example

For my setup I used ModbusPal (Slave) on a Kali VM host and MBTGET (Master) on a Linux VM host.

Modbus Slave : 192.168.171.182
Modbus Master : 192.168.171.139

Analyzing Modbus traffic

The network captures are done with the use of vmnet-sniffer to get the traffic between different virtual machines running on OSX.

sudo "/Applications/VMware Fusion.app/Contents/Library/vmnet-sniffer" -w modbus.pcap vmnet8

Later on you can then read the pcap files with Wireshark. Modbus TCP traffic runs on tcp/502.

Setting up ModbusPal

First we have to setup ModusPal to emulate a Modbus slave. After downloading ModbusPal you can run it with

 
java –jar ModbusPal.jar

Add a slave, edit the slave and add some coils.


ModbusPal

Ideally you also alter the value of some of the coils. Remember these are booleans, so the value is either 0 or 1. Then click Run to start the slave.

MBTGET

Now switch over to your Linux client with MBTGET installed. The usage of MBTGET is fairly easy:

usage : mbtget [-hvdsf] [-2c]
               [-u unit_id] [-a address] [-n number_value]
               [-r[12347]] [-w5 bit_value] [-w6 word_value]
               [-p port] [-t timeout] serveur

You have to use -r1 to read coils and with -r3 you can read holding registers.

Querying coils in Modbus

The first traffic capture is querying the coils in our slave. As a reminder, the network captures are done with vmnet-sniffer and then opened in Wireshark. I use this Modbus command

mbtget -r1 -u 1 -n 8 192.168.171.182

It will read 8 registers from unit id 1 from the slave at 192.168.171.182. The output is

values:
  1 (ad 00000):     0
  2 (ad 00001):     0
  3 (ad 00002):     1
  4 (ad 00003):     0
  5 (ad 00004):     1
  6 (ad 00005):     0
  7 (ad 00006):     0
  8 (ad 00007):     0

In Wireshark I filter the traffic to Modbus only with

tcp.port == 502

In the network capture you can first observe the TCP 3-way handshake followed by the first Modbus packet.


Modbus traffic 1

Let’s have a look at the Modbus packet. Wireshark has a decoder for Modbus (at least for captures done via TCP, for serial captures you have to set mbrtu in the user DLT) which makes it easier to look at the data. The network capture shows that we requested to read 8 bit (the -n 8) from coils (the -r1) in the unit id 1 (-u 1)


Modbus traffic 2

The next packet is the Modbus reply packet. In the reply packet you can see that the Transaction Identifier (36710) is the same as in the previous request. This is the way that Modbus synchronizes the communication. The reply also contains the requested function (F1 – read coils) and the unit identifier (1). The most interesting part is the data, or the payload.


Modbus traffic 3

The data is 14. This is 14 in hexadecimal. The coil values are booleans or binary values. So we have to convert the 14hex to a binary value.

1 = 0001
4 = 0100

So in binary this becomes 00010100.

This binary values corresponds with how we set the coils previously in ModbusPal. The third and fifth registers were set to 1.

Retrieving holding registers in Modbus

For the next capture I set the value for three holding registers.


MobusPal
and then query the Slave for its values with

mbtget -r3 -u 1 -n 8 192.168.171.182

values:
  1 (ad 00000):     0
  2 (ad 00001):     5
  3 (ad 00002):     0
  4 (ad 00003):    10
  5 (ad 00004):     0
  6 (ad 00005):    20
  7 (ad 00006):     0
  8 (ad 00007):     0

In the traffic capture you can now see that the requested function is Read Holding Registers (F3) with a length of 8.


Read holding registers

The Modbus reply holds the requested function call (3) together with the results of the 8 (starting from 0) registers.


Read Holding Registers

Writing to holding registers in Modbus

Now let’s have a look what happens if we write to a holding register.

mbtget -w6 333 -u 1 -a 8 192.168.171.182

word write ok

The ModbusPal interface will show that the register 9 (mbtget starts counting at 0, ModbusPal at 1) holds the value 333.

The packet capture shows a familiar output. First the 3-way handshake and then a Modbus packet. This packet contains the function request Write Single Register together with the reference number (8) and the payload (data, 014d).


Write Holding Registers

The response packet (verify the sequence number to make sure you are looking at the correct combination of request/response) again contains the requested function (6) together with the submitted payload.


Write Holding Registers

Nmap modbus-discover

You can search for Modbus devices with nmap. What’s more, there’s a script that gives you more information on the Modbus device.

sudo nmap -p 502 -sV --script modbus-discover.nse 192.168.171.182

If you take a look at the source of the script you can see that it tries to discover the available device IDs.

  for sid = 1, 246 do
    stdnse.debug3("Sending command with sid = %d", sid)
    local rsid = form_rsid(sid, 0x11, "")

Notice the 0x11. The hex value 0x11 corresponds with 17 decimal. The Modbus function code 17 is a diagnostics function to Report Slave ID. If you open a packet capture from when nmap was running you will notice the same request.

NMAP Modbus Discovery

The reply from ModbusPal indicates that this function request is not supported.

The next part of the NSE discovery script sends another request.

discover_device_id_recursive = function(host, port, sid, start_id, objects_table)
  local rsid = form_rsid(sid, 0x2B, "\x0E\x01" .. bin.pack('C', start_id))
  local status, result = comm.exchange(host, port, rsid)

Again notice the payload 0x2B. The hex value 0x2B corresponds with 43 decimal. The Modbus function code 43 is also a diagnostics function to Read Device Identification. This is confirmed in the pcap capture.

NMAP Modbus Discovery

Online PCAP captures

If you want to practice your skills with reading Modbus PCAP captures then have a look at pcapr.net and query for Modbus.

Conclusion

Modbus TCP traffic is not that hard to read and understand. The biggest challenge that you will probably face is capturing the traffic, especially if it concerns serial communication. Serial Modbus communication is no different than Modbus TCP communication, so once you have the capture and make Wireshark understand the communication it is easy to analyze.

Remember that this is a protocol with little to none security built-in. This makes it easier to capture and read but also more difficult to protect.

Intro to PLCs, ICS and SCADA

ICS

Industrial Control Systems or ICS have received a lot of attention lately. In the US the ICS-CERT was established and ENISA has a whole unit devoted to Industrial Control Systems/SCADA. But for most people working in IT it is still a relatively new playing field.

Because every area in technology has its own specific vocabulary I wrote a small intro to PLCs, ICS and SCADA of the different components that play in the ICS field.

This summary is based on a video of a workshop Industrial Control Systems : Pentesting PLCs 101 at Black Hat. The workshop was given by Arnaud Soullié. The video contains much more details than covered in this post so be sure to check it out. The downside of video material is that it isn’t that easily accessible as a reference … hence this post.

Arnaud Soullié

What is PLC, ICS, SCADA?

What is an ICS?

What is an Industrial Control Systems or ICS? An ICS is divided into different parts.

  • Production network
    • Sensors, the input and output to the PLCs
    • RTU, the Remote Terminal Units (a PLC, to be used remotely)
    • Contains classical wireless networks
  • Supervision network
    • Sometimes called the SCADA network
    • Workstations with the supervision software installed
    • This is the place from where engineers manage the processes
    • Maintenance laptops
    • Servers specific to the process
  • Corporate network
    • Workstations
    • Connected with supervision network for gathering data for optimization
    • Import data to SAP (or any other ERP)

What we call ICS is basically production and supervision network. It is the network that has the connection with the physical world.

Vocabulary

A bit of vocabulary:

  • ICS : Industrial Control System
  • IACS : Industrial Automation and Control Systems
  • SCADA : Supervisory Control And Data Acquisition
  • DCS : Distributed Control System

Remember that SCADA is only one part of the ICS but sometimes people mix the terms. If someone refers to SCADA make sure that they don’t mean the entire ICS.

ICS Components

An ICS often consists of these components

  • Sensors and actuators : The connectors to the real physical world. Consider the sensor as some kind of switch and the actuator as the component that does the action.
  • Local HMI : Human Machine Interface, useful to interact with a subprocess
  • PLC : programmable logic control manages the sensors and actuators
  • Supervision screen : remote supervision of the industrial process
  • Data historian : records data and allows exporting to the corporate network

Stuxnet: game changer

The discovery of Stuxnet in 2010 / 2011 changed the view on ICS security. What is currently wrong with ICS security?

  • No awareness : they care about physical safety and not security, often remote access of the process is not always assessed properly;
  • Limited staff : only a few people involved with IT (and that most often does not mean ‘security’);
  • Lack of network segmentation : There are no real DMZ or firewalls. The access control is done via ACLs on routers. Sometimes it’s fairly easy to jump from the corporate network to the ICS network;
  • Vulnerability management : it is not easy to apply patches because you can not just shut down a plant. Often the Windows machines are not patched (sometimes because they are not connected to the Windows Update Systems). PLCs are sometimes updated with firmware updates but patching also requires a shutdown of the industrial process. Because of this, although the patches are published they are rarely applied;
  • Security protocols : there is no IT security included in the protocols (no authentication, clear text protocols, …);
  • Third party management : some environments need to allow remote support to their specific devices;
  • Security supervision : ICS is all about monitoring a process, not monitoring the security state of a process.

ICS is about monitoring an industrial system, not monitoring the security state of a system.

What is a PLC?

A PLC is a programmable logic control. It is some kind of real-time computer. It is designed to manage input and output of processes. It was invented to replace electric relays.

It consists of hardware, firmware/OS and applications. The last is one is the programmable logic that is run through the middleware. There are different ways to program a PLC. The “ladder logic” was the first programming language for PLC, as it mimics the real-life circuits. Afterwards there were 5 programming languages defined for PLCs.

Unity Pro is software that you have to use if you want to control most of the Schneider PLCs.

Where do you find systems on the Internet?

You can find a list of systems (not restricted to PLCs) connected to the Internet via Shodan. You can search for “interesting” strings. For example search for Schneider PLC: M340 or S7-1200.

Modbus

Modbus Protocol

Modbus is a serial communication protocol. It is the most widespread used protocol within ICS.

I have a separate blog post with an introduction to Modbus TCP traffic.

Detecting PLCs

Next to using Shodan you can use a couple of scripts to detect PLCs on your network. A word of warning. The TCP/IP stack in some PLCs might not be fully mature. If you send uncommon traffic you might crash the PLC. Never do the scanning without permission.

You can use

  • nmap : network port scanner
  • PLCScan : PLC devices scanner (port 102 for Siemens, port 502 for Modbus)

Nmap has a script to query for example Modbus devices and Siemans S7 PLC devices.

sudo nmap -p 502 -sV --script modbus-discover 127.0.0.1
sudo nmap -p 102 -sV --script s7-info 127.0.0.1

Detect attacks on ICS devices

There are a number of techniques and tools that you can use to detect attacks on ICS devices. A large number of these attacks will contain a network component. This means that using basic network security monitoring and intrusion detection will already get you very far.

Honeypot

Conpot is a low interactive server side Industrial Control Systems honeypot designed to be easy to deploy, modify and extend.

Industrial Control Systems Library: Poster

The Fall 2015 poster from the SANS institute details the SANS ICS Curriculum and what categories of actions contribute to security.

Introduction to Modbus TCP traffic

I have a separate blog posting with an introduction to Modbus TCP traffic

Fixing the Kibana geo_point error for MHN (Modern Honey Network)

Honeypots

I have been working with honeypots for a long time. I consider them one of the best sources for statistics and ongoing trend. Most importantly they give insight information on new exploit and attacker activity.

In the past I used my own set of tools to collect the information from different honeypots. The tools are available on GitHub cudeso-honeypot. I have an old blog post on ‘Using ELK as a dashboard for honeypots’.


Cudeso-Honeypot

Cudeso-Honeypot

Modern Honey Network

Since a couple of months I migrated some honeypots to Modern Honey Network from ThreatStream. It’s a much more “polished” setup than my collection of scripts.

MHN uses MongoDB as a storage back-end but it is fairly easy to get the data in Elasticsearch. I prefer the Elasticsearch, Logstash and Kibana setup because

  • Kibana is an intuitive web interface;
  • ELK has a powerful search engine;
  • It is reliable, fast and extendable;
  • The graphs (dashboard!) in Kibana are easy to setup.

The default install (from GitHub) of MHN uses older versions of Elasticsearch, Logstash and Kibana. Because I wanted to extend some of the features of MHN (basically the enrichment of the data via Logstash) I upgraded the ELK stack to

Elasticsearch 2.1.0
Logstash 1:1.5.5-1
Kibana 4.3.0

The upgrade was, beside some minor changes to the configuration files, a straightforward process. Unfortunately after the upgrade it was no longer possible to have Kibana map the data on world maps (the “geo”-feature).

Setting up a tile map (a geographic map) resulted in an error: No Compatible Fields: The “mhn-*” index pattern does not contain any of the following field types:” geo_point.


no_geopoint

This issue is listed in the Elastic discussion forum.

Fixing the Kibana geo_point error for MHN

The problem is solved by submitting your own index template AND changing the way Logstash parses the MHN data.

Submit the Elasticsearch template

The first step that we have to take is stopping Logstash so that no new data is processed.

sudo supervisorctl stop logstash

Then we have to remove all the existing data. Note that you can apply new templates to existing indexes but this requires that you remove the data, apply the template to all the indexes and then re-import all the data. If you have daily indexes this becomes cumbersome. I decided to go with a new, empty, database of honeypot data.

curl -XDELETE 'http://localhost:9200/_all'

You should get

{"acknowledged":true}

Now upload the new template. Note that this template applies geo_point to source IP (src_ip) and destination IP (dest_ip). The source IP and destination IP (dest_ip) are set to the field type “IP”.

curl -XPUT http://localhost:9200/_template/mhn_per_index -d '
{
    "template" : "mhn-*",
    "mappings" : {
      "event" : {
        "properties": {
            "dest_port": {"type": "long"},
            "src_port": {"type": "long"},
            "src_ip": {"type": "ip"},
            "dest_ip": {"type": "ip"},
            "src_ip_geo":{
               "properties":{
                "location":{"type":"geo_point"}
               }
            },
            "dest_ip_geo":{
               "properties":{
                "location":{"type":"geo_point"}
               }
            }
        }
      }
    }
}'

After submitting the command you should get

{"acknowledged":true}

Edit MHN Logstash configuration

Now we need to change the way Logstash parses the MHN data. I will also include some of the changes that are needed for having Logstash interact with the new Elasticsearch version (document_type, host-notation).

Open the MHN Logstash configuration file.

sudo vi /opt/logstash/mhn.conf

input {
  file {
    path => "/var/log/mhn/mhn-json.log"
    start_position => "end"
    sincedb_path => "/opt/logstash/sincedb"
  }
}

filter {
  json {
    source => "message"
  }

  geoip {
      source => "src_ip"
      target => "src_ip_geo"
      database => "/opt/GeoLiteCity.dat"
      add_field => ["[src_ip_geo][location]",[ "%{[src_ip_geo][longitude]}" , "%{[src_ip_geo][latitude]}" ] ]
  }

  geoip {
    source => "dest_ip"
    target => "dest_ip_geo"
    database => "/opt/GeoLiteCity.dat"
    add_field => ["[dest_ip_geo][location]",[ "%{[dest_ip_geo][longitude]}" , "%{[dest_ip_geo][latitude]}" ] ]
  }
}

output {
  elasticsearch {
    hosts => "127.0.0.1:9200"
    index => "mhn-%{+YYYYMMddHH00}"
    document_type => "event"
  }
}

What has changed?

4a5
>     sincedb_path => "/opt/logstash/sincdb"
17,21c18
<       add_field => [ "[src_ip_geo][coordinates]", "%{[src_ip_geo][longitude]}" ]
<       add_field => [ "[src_ip_geo][coordinates]", "%{[src_ip_geo][latitude]}"  ]
<   }
<   mutate {
<     convert => [ "[src_ip_geo][coordinates]", "float"]
---
>       add_field => ["[src_ip_geo][location]",[ "%{[src_ip_geo][longitude]}" , "%{[src_ip_geo][latitude]}" ] ]
28,29c25
<     add_field => [ "[dest_ip_geo][coordinates]", "%{[dest_ip_geo][longitude]}" ]
<     add_field => [ "[dest_ip_geo][coordinates]", "%{[dest_ip_geo][latitude]}"  ]
---
>     add_field => ["[dest_ip_geo][location]",[ "%{[dest_ip_geo][longitude]}" , "%{[dest_ip_geo][latitude]}" ] ]
32,34d27
<   mutate {
<       convert => [ "[dest_ip_geo][coordinates]", "float"]
<     }
39,41c32
<     host => "127.0.0.1"
<     port => 9200
<     protocol => "http"
---
>     hosts => "127.0.0.1:9200"
43c34
<     index_type => "event"
---
>     document_type => "event"
45a37
>

Now we need to restart Logstash. Check the logfiles for any errors.

sudo supervisorctl start logstash  

sudo tail /var/log/mhn/logstash.err
sudo tail /var/log/mhn/logstash.log

Fixing Kibana

Next is fixing the way Kibana deals with the indexes. First check that you already have data in the Elasticsearch database. The indexes will be auto created once you insert data in the database

curl 'localhost:9200/mhn-*/_search?pretty&size=1'

Kibana will prompt you to supply a valid index


kibana-index1

Add mhn-* as the index. Make sure that you check the box to indicate that the data is time-based. Then click create.

kibana-index2

Once all this is done you can now retry to create a geomap. If all went well Kibana will recognise the geo_point field.


active_geopoint


Geomap Kibana
Geomap Kibana

Changes to MHN

I’ve been running MHN with a couple of changes. For example enrichment of IP data from certain honeypots with information retrieved from external sources (VirusTotal), extraction of connections from specific networks and ASNs and full request logging via HPFeed for Glastopf.

So far the changes are still work in progress but once everything is finished the scripts will be published on GitHub.

Logging nfsen queries

Netflow, nfdump and nfsen

In two previous posts I covered “What is netflow and when do you use it?” and “Use netflow with nfdump and nfsen“.

Nfsen provides a web interface on netflow data made available via nfdump. Because of the nature of the netflow data it is important to have strict access controls and extensive logging on the nfsen access. You should have a complete access and query log of who did what at any given time.

Access to the nfsen web interface is logged via the normal web server logging mechanism. This means you have the timestamp, the remote IP, the requested resource (nfsen.php) and some browser identification data.

The actual queries that you do in nfsen are send via a POST request. These queries are for example tracking connections towards a specific network port, connections from one host, etc.


Nfsen POST request

Contrary to GET requests, the POST requests are not automatically logged. A GET request typically consist of a URL with a number of parameters and these get logged in the normal web server access logs. POST parameters are send as part of the ‘body’ of the request and as such do not end up in the logfile.

There is a solution to logging the POST variables. It is based on an ISC SANS post on Tracking HTTP POST data with ELK. You can use mod_security for logging all these variables.

Do note that logging the POST variables logs everything. Be aware of this if you enable POST logging on a site that submits confidential information via the POST request (creditcard numbers, user information, …).

mod_security for logging POST variables

mod_security is an open source web application firewall. You can use it to protect your web server but also to have more audit capabilities.

Apache – Installation

Installation (on Ubuntu) for Apache is straightforward

sudo apt-get install libapache2-mod-security2
sudo a2enmod security2

Nginx – Installation

The extensibility model of the nginx server does not include dynamically loaded modules, thus ModSecurity must be compiled with the source code. You need a couple of prerequisites to compile both nginx and ModSecurity.

sudo apt-get install libxml2 libxml2-dev libxml2-utils libaprutil1 libaprutil1-dev
sudo apt-get install libtool autoconf
sudo apt-get install apache2-dev

Although you’re building for nginx you still need the Apache development libraries. The next step is getting ModSecurity from GitHub, running the config script and compiling.

cd /usr/local/src
git clone https://github.com/SpiderLabs/ModSecurity.git mod_security
cd mod_security
./autogen.sh
./configure --enable-standalone-module --prefix=/usr/local/ --disable-mlogc
make
sudo make install

We don’t need mlogc. If you do then you should also install the curl libraries.

Once ModSecurity is build you should download the source of nginx and compile the server.

cd /usr/local/src
wget http://nginx.org/download/nginx-1.8.0.tar.gz
tar zxvf nginx-1.8.0.tar.gz
cd nginx-1.8.0/
./configure --user=www-data --group=www-data --add-module=../mod_security/nginx/modsecurity --with-ipv6 --prefix=/usr/local
make
sudo make install

I prefer to use the www-data user and group. It makes it easier to switch between Apache and Nginx if I decide to use another web server architecture.

If you use nginx for nfsen you will also have to install php-fpm and enable the PHP handler. You have to enable ModSecurity in the same section where you enable PHP (after all, the main script of nfsen is nfsen.php). Your PHP handler should look like this

location ~ \.php$ {
        ModSecurityEnabled on;
        ModSecurityConfig /etc/nginx/modsecurity.conf;
        proxy_pass http://localhost;
        proxy_read_timeout 180s;
        fastcgi_split_path_info ^(.+\.php)(/.+)$;

        fastcgi_pass unix:/var/run/php5-fpm.sock;
        fastcgi_index index.php;
        include fastcgi_params;
}                

The core of the ModSecurity configuration for Nginx will be in the file /etc/nginx/modsecurity.conf.

Configuration

In this setup I’m not going to use mod_security to act as a web firewall but use it only for extra audit capabilities. This means I do not have to install extra rulesets etc.

Open the main mod_security configuration file. This is /etc/apache2/mods-enabled/security2.conf for Apache and /etc/nginx/modsecurity.conf for Nginx and add these configuration settings

SecRuleEngine On
SecRequestBodyAccess On
SecAuditLogParts ABCZ
SecAuditLog /var/log/apache2/modsec_audit.log
SecRule REQUEST_METHOD "POST" "id:1000,phase:2,ctl:auditEngine=On,nolog,pass"
  • SecRuleEngine : Enable mod_security;
  • SecRequestBodyAccess : Allow access to the body (needed for POST);
  • SecAuditLogParts : Only log audit parts A, B and C (Z is mandatory);
  • SecAuditLog : Path for the logfile;
  • SecRule : Rule to apply to POST requests.

The audit log is only enabled when the SecRule triggers. This prevents log pollution. As you can see the parts that are audited are limited to A, B and C. These parts correspond with

  • A : Audit log header (mandatory);
  • B : Request headers;
  • C : Request body;
  • Z : Final boundary, signifies the end of the entry (mandatory).

Do not forget to restart your web server after committing these changes.

Logging nfsen queries

This is an example of the C-part of the audit log for an nfsen query

--cd9ee07d-C--
srcselector%5B%5D=local&filter=dst+host+192.168.218.1%0D%0A&filter_name=none&DefaultFilter=-1
&modeselect=1&listN=0&topN=0&stattype=0&statorder=0&aggr_srcselect=0&aggr_srcnetbits=24
&aggr_dstselect=0&aggr_dstnetbits=24&limitwhat=0&limithow=0&limitsize=0&limitscale=0
&output=auto&customfmt=&process=process

The parameters for the nfsen POST request are all concatenated into one large string but with some minor scripting you should be able to extract the parameters useful for your specific logging.

  • srcselector : the netflow data source (in this case ‘local’);
  • filter : the filter that was used in the query (in this case dst host 192.168.218.1);
  • stattype : type of details fe. flow records, any IP, SRC or DST IP (in this case flow records);
  • statorder : the sort order for the details.

Conclusion

Netflow data is a very useful source of data for incident investigation but it can also cause some privacy concerns. Because of this you should limit access to the netflow data and do full and proper logging of all the queries done on the netflow data.

Use netflow with nfdump and nfsen

Netflow

In a previous post I described what is netflow and when do you use it. This post describes how to use netflow with nfdump and nfsen.

Netflow with nfdump and nfsen

Command line and web interface

Having netflow is great but of course you’d like a way to view your netflow data. I’m covering the nfdump and nfsen tools.

nfdump is the command line interface whereas nfsen is the web interface. Both tools can be used together. In fact, nfsen is a web wrapper around the nfdump command line. What’s more, the nfsen web interface always outputs the corresponding command and options that you have to use to re-produce the same output via command line.


Nfsen - command line output

Installation of nfdump

Before you can start with nfdump you will need a couple of Linux prerequisites:

sudo apt-get install flex
sudo apt-get install librrd-dev
sudo apt-get install librrds-perl
sudo apt-get install libmailtools-perl
sudo apt-get install libsocket6-perl

Note that if you do not already have a LAMP installation you might also want to install Apache and PHP. This is needed for nfsen.

Then download nfdump and nfsen in /usr/local/src and extract them.

The nfdump process needs its own user. For simplicity you can use user netflow. This user will have to be part of the www-data group to allow nfsen access to the netflow data.

sudo useradd netflow
sudo vigr 
 -> have it look like this
   www-data:x:33:netflow

Now enter the nfdump directory, run the configure script, make and build the binaries.

cd /usr/local/src/nfdump-1.6.13
./configure --enable-nfprofile --enable-nftrack --enable-sflow --enable-readpcap --enable-nfpcapd
make
sudo make install

The configure script uses a couple of options, this is what they do :

  • –enable-nfprofile : needed for nfsen, build nfprofile;
  • –enable-nftrack : needed for portracker (nfsen module);
  • –enable-sflow : build sflow collector sfcpad;
  • –enable-readpcap : build nfcapd collector to read from pcap file instead of network data;
  • –enable-nfpcapd : build nfpcapd collector to create netflow data from interface or pcap data

Configuration and installation of nfsen

For nfsen you have to have a working web server with PHP support. Enter the nfsen directory, make a copy of the default config file etc/nfsen-dist.conf to etc/nfsen.conf and update the file.

cd /usr/local/src/nfsen-1.3.6p1/    
cp etc/nfsen-dist.conf etc/nfsen.conf

In nfsen.conf you have to do these changes

$WWWUSER  = "www-data";
$WWWGROUP = "www-data";

$PERL_HAS_MEMLEAK=1;

If you’re not happy with the default proposed datadirectory then change the setting $BASEDIR.

Now you have to configure the netflow sources, enable plugins and set the e-mail server for the alert e-mails. Open the nfsen.conf again. We’ll add the source we created before with pmacctd.

     %sources = (
         'local'       => { 'port' => '9001', 'IP' => '127.0.0.1', 'col' => '#0000ff' }
    );

The porttracker plugin allows you to get quick overviews on the most used network ports.


Porttracker plugin - graphs
Porttracker plugin - data

    @plugins = (
        # profile    # module
        # [ '*',     'demoplugin' ],
         [ '*', 'PortTracker' ],
    );

Netflow is capable to send you alerts by e-mail. To have this working properly you have to configure the e-mail server and the sender.

    $MAIL_FROM   = 'changeme@example.com';
    $SMTP_SERVER = 'localhost';

Now you have to run the install script to create the necessary directories and files. In the nfsen directory do this

sudo ./install.pl etc/nfsen.conf

You will be asked to set what Perl version to use and when all goes well the output should conclude with ‘setup done’. In order to get the porttracker plugin working you need to take some extra steps.

touch /data/nfsen/profiles-stat/hints
chown netflow:www-data /data/nfsen/profiles-stat/hints

Finally you should also tweak your Apache configuration. The main script used by nfsen is nfsen.php. It makes sense to set this script as the default script to execute when accessing the nfsen website.

Ideally you have this website run over SSL, preferably restricting access with a client SSL certificate.

<VirtualHost _default_:443>
        ServerName nf.mydomain.be
        DocumentRoot /var/www/nfsen
        DirectoryIndex nfsen.php
...
</VirtualHost>

Adding sources to nfsen

If you want to add an additional netflow source to nfsen you will have to add it to the nfsen.conf file. After adding it you have to go through the install process again.

sudo ./install.pl etc/nfsen.conf

This will also stop and restart the nfsen processes.

Starting and stopping of nfsen

The nfsen command in $BINDIR is also used to start and stop NfSen

bin/nfsen start
bin/nfsen stop

Working of nfdump and nfsen

Basically how nfdump and nfsen works is that it uses different nfcapd processes to read the netflow data from the network and store the data into files. The files are organized in a time based fashion in a dedicated directory (most often /data/nfsen) and frequently rotated (typically every 5 minutes). This results in

/data/nfsen/profiles-data/<profile-name>/<source-name>/<year>/<month>/<day>/nfcapd.<year><month><day><hour>20
/data/nfsen/profiles-data/<profile-name>/<source-name>/<year>/<month>/<day>/nfcapd.<year><month><day><hour>25
/data/nfsen/profiles-data/<profile-name>/<source-name>/<year>/<month>/<day>/nfcapd.<year><month><day><hour>30


Netflow - operational

Every query started via the web interface of nfsen will continue to run until its finished, regardless if you tried to stop the web-process. If you want to cancel a long running nfsen query you will have to kill (on the command line) the corresponding nfdump command.

Using nfsen

Overview page

Once you have configured all of the above it’s time to have a look at the capabilities of nfsen. The default web interface has a couple of tabs. By default you’ll get an overview of the traffic per day, week, month mapped out per flow/s, packets/s and bytes/s.


Nfsen overview

Details page

But eventually you’ll want to click on the Details tab. That is the page that will allow you to get the most out of netflow.

The details page consists of three major blocks

  • Graphs : a visual overview of flows, packets and bytes;
  • Statistics : a statistical overview of flows, packets and bytes;
  • Query : a query form

Details – graphs

The visual overview of the number of flows, packets and bytes gives you immediate access on what’s going on. The details page has a couple of options to fine tune what you are seeing.


Nfsen - details

  • 1 : do a query based on a single timeslice or a time window. If you choose for time window you are able to move the sliders (7) to the start and end of the desired timeframe, for a single timeslice you can move the slider to the left or right;
  • 2 : display information for a day, a week or another timeframe. Note that this is only the visual representation, it does not influence the time window of your query;
  • 3 : move the graphs to the end or the beginning of a timeframe;
  • 4 : display the data based on the number of bytes;
  • 5 : display the data based on the number of packets;
  • 6 : filter on only TCP, UDP, ICMP, other or all the traffic;
  • 7 : the time slider that allows you to set the time window.

The next part of the details page contains the statistics for the different sources.


Nfsen - statistics

The last part of the details page contains the part that you will probably be using the most. It’s the query part that allows you to query the netflow data.


Nfsen - Queries

  • 1 : the nfdump filter;
  • 2 : the netflow sources;
  • 3 : set the sortorder;
  • 4 : get flow data, host data, …;
  • 5 : aggregation options.

The use of the nfsen web interface, together with a couple of examples, is described in detail on the nfsen website.

Profiles

The profiles in nfsen are a powerful feature to build a specific view on your data. A profile is defined by its name, type and one or more profile filters. It’s an ideal solution if for example you want to

  • have a view specific for the HTTP and HTTPs traffic;
  • have a view for traffic coming from a specific network source;
  • have a view for traffic with specific TCP flags.

Alerts

Nfsen has a feature that allows you to get e-mail alerts when an nfdump query is matched. This alerting is an ideal solution if you want to get notices when a connection has been detected towards for example a C2 server.

You can set a number of thresholds and conditions before the alerts triggers.


Nfsen alerting - threshold

An existing alert also holds a graphical overview of traffic that matched the nfdump query.


Nfsen - alerting

Conclusion

Netflow data, especially when analyzed via nfdump or nfsen, is an excellent source to have both an overview of what is going on on your network and detect malicious (network) activity. It requires some training to getting used to extract actionable data but especially for network based activity it is a very useful source of data.

If you do not have access to network devices you can still use netflow data based on network traffic that is exported by Linux or BSD hosts.

What is netflow and when do you use it?

What is netflow?

Intro

Netflow is a feature that was introduced on Cisco routers and that provides the ability to collect IP network traffic as it enters or exits an interface. Netflow data allows you to have an overview of traffic flows, based on the network source and destination. Because of this it lets you understand who is using the network, the destination of your traffic, when the network is utilized and the type of applications that consume the most bandwidth.

Netflow is not limited to Cisco. You can get it for most network devices and also generate it from a Linux or BSD host.

This post describes what is netflow and when do you use it. It also covers how to configure it on network and Linux devices. In a follow-up post I will describe how to use netflow with nfdump and nfsen.

What is an IP flow?

An IP flow is a sequence of network packets. An IP flow most often contains these elements

  • IP source address
  • IP destination address
  • Source port
  • Destination port

Additionally it can also contain things such as the TCP flags (to examine TCP handshakes) or the next-hop.

Netflow sampling

The default netflow implementation was a representation of every IP packet detected (a ‘1 to 1’ relation). Especially in high-traffic environments (for example hosting companies or ISPs) this can become to resource intense, both for storage and processing power. That is when sampled netflow was designed.

Sampled netflow is where every one packet out of n packets is processed. The sampling rate is “n”. The sampling method can be different. Some implementations select every n packet, others select one random packet in an interval of n packets and some implementations even use other selection methods.

How much space do you need for netflow data?

The amount of disk space needed for storing netflow data is dependant on the netflow version used, the sampling rate and obviously the amount of netflow records that are exported.

Lancope has a bandwidth calculator that gives you an estimate of how many bits per seconds are exported. As an estimate, a network with 40 routers exporting netflow data on a 40Gbps network sampled at 1 on 100 packets uses about 3 TB for 3 months of netflow data.

Use cases for netflow

Verify network IOCs

Sometimes the APT reports contain the addresses of C2 servers. If you want to check if someone on your network is affected and ever connected (or is connecting) to these C2s then you can use netflow to query the current and the past network connections.

ISP setup and visibility

If you run an ISP you can not just capture every packet that enters or leaves your network. It would be practically very difficult, costly and most important you’d be breaking a number of privacy laws. Using sampled netflow is then a very good alternative for both preserving the privacy of your customers and still being able to have a good view on what is happening on your network.

Timeline construction during incident response

If you suffer from an incident and your devices did not log all the request then netflow data allows you to reconstruct when exactly that the different network events took place. It’s also a great tool to get more easily to the root cause of an incident.

Attack fingerprinting

Netflow data can help you with fingerprinting the type of network attack that is targeting you. Netflow data can learn you what the source and destination addresses and ports are. This type of fingerprinting can be especially useful during a DDoS attack, both in detecting the volume but also the sources that participate in the attack (if they are not spoofed) and the different network ports and protocols that are being attack.

Different versions of netflow

Netflow is available in different versions, the most popular versions being v5 and v9. The major difference between the two versions is that netflow v5 is fixed whereas v9 is dynamic. The information in netflow version 5 cannot be extended (neither by Cisco or a third-party).

  • netflow version 5 :
    • suited for IPv4
  • netflow version 9 :
    • suited for IPv6
    • works with templates (need to be sent periodically)
    • MPLS

Where do you configure netflow?

Network devices

When it concerns network devices then netflow is most often configured on a central location. In essence the location where you configure netflow has to “see” all the network traffic that you’re interested in. Depending on your network architecture this configuration can be done on core routers or on your remote routers.

Cisco netflow configuration

(Example from the nfdump README) The source-address of the router that is exporting the data is 192.168.200.5 and it is exporting netflow version 5 to a collector at 192.168.1.233 on port udp/9003.

ip address 192.168.200.5 255.255.255.224
  interface fastethernet 0/0
  ip route-cache flow
ip flow-export 192.168.1.233 9003
ip flow-export version 5
ip flow-cache timeout active 5

Juniper netflow configuration

The configuration below is suited for Juniper JunOS. The source-address of the router that is exporting the data is 192.168.200.5 and it is exporting netflow version 9 with a sample rate of 1/100 to a collector at 192.168.1.233 on port udp/9003.

sampling {
    input {
        rate 100;
        run-length 0;
        max-packets-per-second 65535;
    }
    family inet {
        output {
            flow-server 192.168.1.233 {
                port 9003;
                autonomous-system-type origin;
                source-address 192.168.200.5;
                version9 {
                    template {
                        ip;
                    }
                }
            }
            interface sp-2/1/0 {
                source-address 192.168.200.5;
            }
        }
    }
} 

Linux netflow configuration

The Linux kernel has no default support for netflow but you can use the userland tools to generate netflow data. One of the most common solutions for generating netflow from Linux devices is pmacct. This project is primarily built for IP accounting but you can also use it for generating netflow data.

apt-get install pmacct

The configuration file can be found in /etc/pmacct/nfacctd.conf. You have to change these settings

!pcap_filter: net 127.0.0.0/8
aggregate: src_host, dst_host, src_port, dst_port, proto, tos
interface: eth0
plugins: nfprobe
nfprobe_receiver: 127.0.0.1:9001
nfprobe_version: 5

This is what is changed in the configuration file :

  • !pcap_filter : Do not filter (it’s been put in comments);
  • aggregate : The field list that you’d like to export;
  • interface : The interface from which you want to grab the network information;
  • plugins : What plugins to enable;
  • nfprobe_receiver : The receiver of the netflow data (the netflow collector);
  • nfprobe_version : The netflow version.

It is important that you define the capture interface, the netflow version and the address and port of the netflow collector.

I was unable to start the netflow generation via the start-up scripts provided with pmacct. Starting it manually worked out fine though

sudo pmacctd -f /etc/pmacct/nfacctd.conf

You can check if the exporting is properly configured (and running) in syslog

Nov 10 14:47:19 ubuntu pmacctd[919]: INFO ( default/nfprobe ): Exporting flows to [127.0.0.1]:9001

Conclusion

This post is a description of what netflow is, where and how to configure it and when you would be using it.

In a follow-up post I will describe how you can use netflow with nfdump and nfsen to get the most out of your netflow data.